Pods Performance Test
Pod performance refers to how effectively a pod utilizes resources like CPU and memory and maintains responsiveness. Key metrics include resource usage, response time, and application throughput. Monitoring involves tracking these metrics to detect bottlenecks, optimize resource allocation, and ensure pods are performing within expected parameters. Tools like Prometheus, Grafana, and Kubernetes’ built-in metrics server help visualize and analyze pod performance, enabling timely adjustments and troubleshooting.
Monitoring pod performance in Kubernetes is essential to ensure that applications run efficiently and reliably. By tracking metrics like CPU and memory usage, response times, and throughput, you can identify resource bottlenecks, potential failures, and inefficiencies. Effective monitoring helps in optimizing resource allocation, improving application performance, and maintaining system stability. It also aids in proactive problem detection, reducing downtime, and ensuring that service level objectives (SLOs) are met. Tools such as Prometheus and Grafana provide insights that enable informed decision-making and fine-tuning of the Kubernetes environment for optimal performance.
The Pods Performance Test continuously monitors the Pods and reports key performance metrics like number of container, CPU usage, disk and memory usage etc.. Analysis of these numbers over a series of measurement give administrators vital information about the current performance of Pod and can easily notice any dips in performance.
Target of the test : A Kubernetes Worker Node
Agent deploying the test : An internal agent
Outputs of the test : One set of results for each pod in the target Kubernetes Worker node being monitored
|
Parameter |
Description |
|---|---|
|
Test Period |
How often should the test be executed. |
|
Host |
The IP address of the host for which this test is to be configured. |
|
Port |
Specify the port at which the specified Host listens. By default, this is 6443. |
|
Use Sudo |
By default, the eG agent does not require any special permissions to parse and read messages from the log file to be monitored. This is why, the Use Sudo parameter is set to No by default. In some highly-secure Unix environments however, the eG agent install user may not have the permission to read the log file to be monitored. In such environments, you will have to follow the steps below to ensure that the test is able to read the log file and report metrics: Edit the SUDOERS file on the target host and append an entry of the following format to it: <eG_agent_install_user> ALL=(ALL) NOPASSWD: <Log_file_with_path> For instance, if the eG agent install user is eguser, and the log file to be monitored is /usr/bin/logs/procs.log, then the entry in the SUDOERS file should be: eguser ALL=(ALL) NOPASSWD: /usr/bin/logs/procs.log Finally, save the file. Then, when configuring this test using the eG admin interface, set the Use Sudo parameter to Yes. Once this is done, then every time the test runs, it will check whether the eG agent install user has the necessary permissions to read the log file. If the user does not have the permissions, then the test runs the sudo command to change the permissions of the user, so that the eG agent is able to read from the log file. |
|
DD Frequency |
Refers to the frequency with which detailed diagnosis measures are to be generated for this test. The default is 3:1. This indicates that, by default, detailed measures will be generated every third time this test runs, and also every time the test detects a problem. You can modify this frequency, if you so desire. Also, if you intend to disable the detailed diagnosis capability for this test, you can do so by specifying none against DD frequency. |
|
Detailed Diagnosis |
To make diagnosis more efficient and accurate, the eG Enterprise embeds an optional detailed diagnostic capability. With this capability, the eG agents can be configured to run detailed, more elaborate tests as and when specific problems are detected. To enable the detailed diagnosis capability of this test for a particular server, choose the On option. To disable the capability, click on the Off option. The option to selectively enable/disable the detailed diagnosis capability will be available only if the following conditions are fulfilled:
|
|
Measurement |
Description |
Measurement Unit |
Interpretation |
|---|---|---|---|
|
Total containers |
Indicates the total number of container existing on the current pod. |
Number |
You should consider the complexity and management overhead when deciding how many containers to include in a pod. |
|
CPU usage |
Indicates amount of CPU resources consumed by a pod's containers. |
Percentage |
Insights into CPU usage help maintain a balanced and responsive Kubernetes environment. |
|
Memory usage |
Indicates amount of memory resources consumed by a pod's containers. |
MB |
Insights into memory usage help maintain a balanced and responsive Kubernetes environment. |
|
Disk usage |
Indicates amount of disk resources consumed by a pod's containers. |
MB |
Insights into disk usage help maintain a balanced and responsive Kubernetes environment. |
|
Total iNodes |
Indicates the number of INodes existing in the pod. |
Number |
An iNode is a data structure on a file system that stores information about a file or directory, such as its size, ownership, permissions, and location on the disk. Each file or directory has a unique iNode. |
The detailed diagnosis of the Total containers measure reveals the Pod Namespace, Container Name, Container IP and Container Id.
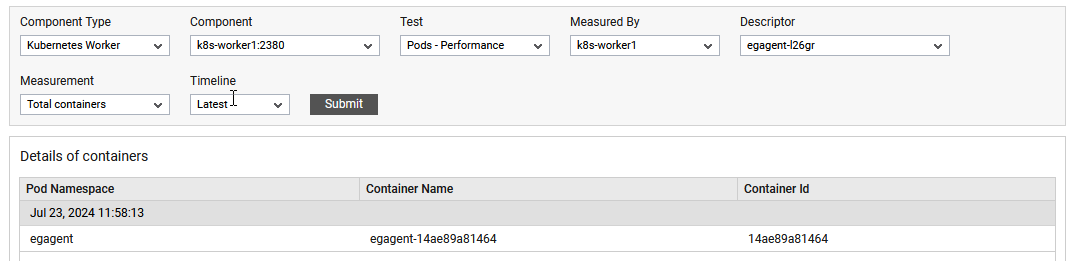
Figure 1 : The detailed diagnosis of total containers measure
The detailed diagnosis of the CPU Usage measure reveals the Pod Namespace, Container Name, Container Id and CPU usage(%).

Figure 2 : The detailed diagnosis of CPU Usage measure
The detailed diagnosis of the Memory usage measure reveals the Pod Namespace, Container Name, Container Id and Memory usage(MB).
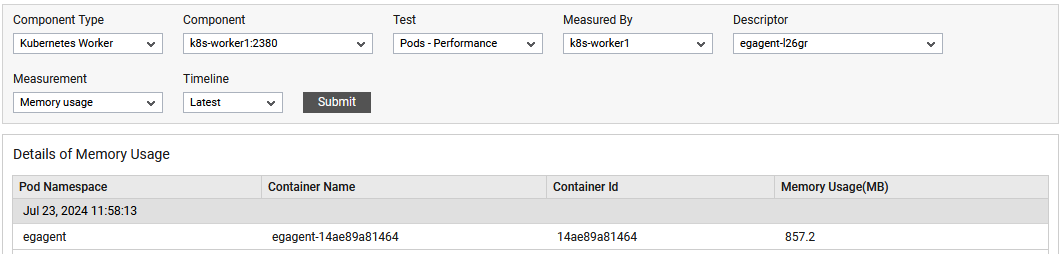
Figure 3 : The detailed diagnosis of Memory usage measure
The detailed diagnosis of the Disk usage measure reveals the Pod Namespace, Container Name, Container Id and Disk usage(MB)
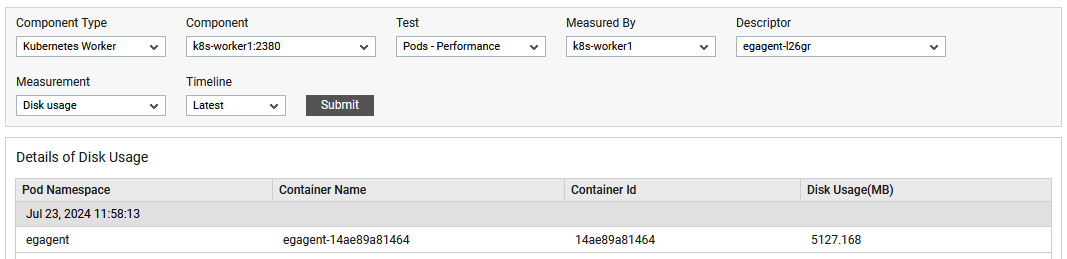
Figure 4 : The detailed diagnosis of Disk usage measure
The detailed diagnosis of the Long running containers measure reveals the Pod Namespace, Container Name, Container Id and iNodes(Number).
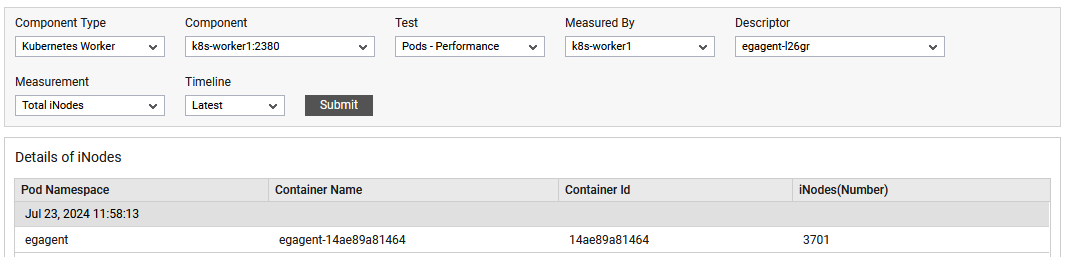
Figure 5 : The detailed diagnosis of total inodes