Proxy Go Engine Test
Kubernetes Proxy Go engine is a component responsible for managing network traffic between services and pods in a Kubernetes cluster. It uses various techniques, such as iptables and IPVS, to implement load balancing and routing. This engine enables seamless communication, supports service discovery, and ensures high availability, helping maintain efficient and resilient microservices architectures.
Proxy Go engine in Kubernetes manages network traffic routing between services and pods. It employs methods like iptables and IPVS for load balancing, ensuring efficient communication and service discovery. This engine is crucial for maintaining high availability and resilience in microservices architectures within a Kubernetes cluster.
The Proxy Go Engine Test continuously monitors the proxy go engine and reports key metrics like number of go routines that are currently available and if Go environment details are available. Analysis of these numbers over a series of measurement give administrators vital information about the current status of proxy go engine and can easily notice any dips in performance.
Target of the test : A Kubernetes Worker Node
Agent deploying the test : An internal agent
Outputs of the test : One set of results for the target Kubernetes Worker node being monitored
| Parameter | Description |
|---|---|
|
Test Period |
How often should the test be executed. |
|
Host |
The IP address of the host for which this test is to be configured. |
|
Port |
Specify the port at which the specified Host listens. By default, this is 6443. |
|
Timeout |
Specify the duration (in seconds) beyond which the test will timeout in the Timeout text box. The default value is 10 seconds. |
|
DD Frequency |
Refers to the frequency with which detailed diagnosis measures are to be generated for this test. The default is 3:1. This indicates that, by default, detailed measures will be generated every third time this test runs, and also every time the test detects a problem. You can modify this frequency, if you so desire. Also, if you intend to disable the detailed diagnosis capability for this test, you can do so by specifying none against DD frequency. |
|
Metric URL |
Each of the Kubernetes system components expose monitoring metrics through /metrics endpoint of the HTTP server. Specify the metric endpoint URL in the Metric URL textbox. |
|
Detailed Diagnosis |
To make diagnosis more efficient and accurate, the eG Enterprise embeds an optional detailed diagnostic capability. With this capability, the eG agents can be configured to run detailed, more elaborate tests as and when specific problems are detected. To enable the detailed diagnosis capability of this test for a particular server, choose the On option. To disable the capability, click on the Off option. The option to selectively enable/disable the detailed diagnosis capability will be available only if the following conditions are fulfilled:
|
|
Measurement |
Description |
Measurement Unit |
Interpretation |
||||||
|---|---|---|---|---|---|---|---|---|---|
|
Goroutines that currently exist |
Indicates the current number of Goroutines that are existing and executing. |
Number |
If too many client certificates are bout to expire that may be an alarming situation. |
||||||
|
Go environment details available |
Indicates if the current environment details are available for Go engine. |
|
The values that this measure reports and their corresponding numeric values are detailed in the table below:
Note: By default, this test reports the Measure Values listed in the table above to indicate if Go environment details are available. In the graph of this measure however, the state is indicated using the numeric equivalents only. The detailed diagnosis of the Go environment details available measure reveals the Go Environment version information. |
The detailed diagnosis of the Details of Go Environment measure reveals the Version information.
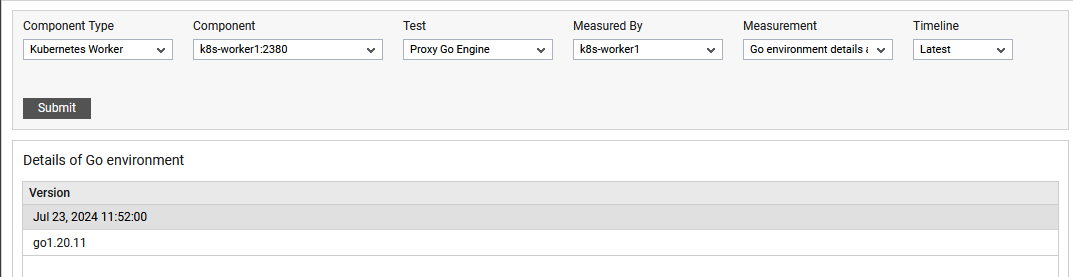
Figure 1 : The detailed diagnosis of Details of Go Environment