AD Access Per Client Process Test
Many client processes/services on the Exchange server interact with Active Directory to obtain useful recipient and configuration information. For example, you have the Microsoft.Exchange.EdgeSyncSvc process that keeps the recipient and configuration information up to date when an Edge Server is subscribed to the same AD site as the Mailbox server. You also have the ADTopologyService that locates Active Directory domain controllers and global catalog servers and provides Active Directory topology information to other Exchange Server services.
When the communication between any of these processes/services and AD slow down, user experience with Exchange will certainly be impacted adversely. If a user then complains that Exchange is slow, administrators will have to instantly figure out which process’s interactions with AD are abnormal and where is the bottleneck – in running LDAP search queries? In processing LDAP read requests? In processing LDAP write requests? The AD Access Per Client Process test provides administrators with these insights. This test auto-discovers the critical client processes/services running on the Exchange server and reports how quickly every process services the LDAP search/read/write requests it receives. In the process, the test accurately pinpoints where the bottleneck is.
Target of the test :An Exchange 2013/2016 Server
Agent deploying the test : An internal/remote agent
Outputs of the test : One set of results for each client process/service on the Exchange server
|
| Measurement | Description | Measurement Unit | Interpretation |
|---|---|---|---|
|
LDAP read calls rate: |
Indicates the rate at which Depth 0 LDAP search calls are made by this process. |
Calls/Sec |
Depth 0 calls refer to search queries that search only the base DN. Compare the value of this measure across processes to identify which process is imposing the maximum read request load on the AD server. Use the detailed diagnosis of this measure to know which instances of a given process are currently communicating with the AD server, and the health of the interactions of each instance. |
|
LDAP read time: |
Indicates the time taken by this process to execute LDAP read requests and return a response. |
Secs |
The average value for this measure should be less than 0.05 seconds. Spikes (Maximum) should not be higher than 0.1 seconds. Compare the value of this measure across processes to identify which process is processing read requests slowly. Once the process is identified, compare the LDAP read time of that process with the value of the LDAP search time and LDAP write time measures to know where exactly the slowdown occurred – when processing search requests, read requests, or write requests? |
|
LDAP search calls rate: |
Indicates the rate at which Depth 1 and 2 LDAP search calls were made by this process. |
Calls/Sec |
Depth 1 and 2 calls refer to search queries that search 1 and 2 levels below the base DN. Compare the value of this measure across processes to identify which process is imposing the maximum search request load on the AD server. |
|
LDAP search time: |
Indicates the time taken by this process to send run an LDAP search query on AD and receive a response. |
Secs |
The average value for this measure should be less than 0.05 seconds. Spikes (Maximum) should not be higher than 0.1 seconds. Compare the value of this measure across domain controllers to identify which process’s queries are being processed very slowly by AD. Once the process is identified, compare the LDAP search time of that process with the value of the LDAP read time and LDAP write time measures to know where exactly the slowdown occurred – when processing search requests, read requests, or write requests? |
|
LDAP timeout errors rate: |
Indicates the number of LDAP operations made per second by this process because of an exceeded timeout. |
Errors/Sec |
|
|
LDAP write calls rate: |
Indicates the rate at which this process made Add/Modify/Delete calls to AD. |
Calls/Sec |
Compare the value of this measure across processes to know which process made the maximum number of add/modify/delete calls to AD and contributed the most to its workload. |
|
LDAP write time: |
Indicates the time taken by this process to send an add/modify/delete request to AD and receive a response. |
Secs |
A consistent increase in this value could indicate a bottleneck when adding/modifying/deleting objects in AD. Compare the value of this measure across processes to identify which process’s write requests are being processed very slowly by AD. Once the process is identified, compare the LDAP write time of that process with the value of the LDAP search time and LDAP read time measures to know where exactly the slowdown occurred – when processing search requests, read requests, or write requests? |
|
Long running LDAP operations: |
Indicates the number of LDAP operations made by this process per minute that took longer than the specified threshold (default threshold is 15 seconds).
|
Operations/Minute |
MaxQueryDuration is an LDAP administration limit that represents the maximum time a domain controller should spend on a single search. When this limit is reached, the domain controller returns a "timeLimitExceeded" error. By comparing the value of this measure across processes, you can identify the process that is responsible for triggering the maximum number of long-running queries. |
|
Outstanding requests: |
Indicates the current number of pending LDAP searches for this process. |
Number |
Compare the value of this measure across processes to identify that process with the maximum number of pending search requests. The reason for this anomaly should be investigated and the source of the processing bottleneck should be cleared for optimal performance of Exchange 2013/2016. |
Use the detailed diagnosis of the LDAP read calls rate measure to know which instances of a given process are currently communicating with the AD server, and the health of the interactions of each instance. From this, you can identify that instance which is taking too long to perform LDAP operations on the AD server, resulting in a slowdown.
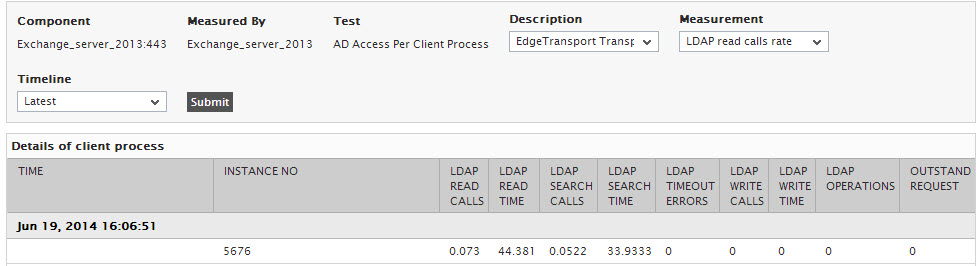
Figure 4 : The detailed diagnosis of the LDAP read calls rate measure