AWS Lambda Test
AWS Lambda is a compute service that lets you run code without provisioning or managing servers. In other words, AWS Lambda runs your code on a high-availability compute infrastructure and performs all of the administration of the compute resources, including server and operating system maintenance, capacity provisioning and automatic scaling, code monitoring and logging. All you need to do is author your code in a language that AWS Lambda supports (currently Node.js, Java, C#, Go and Python), and upload your application code to AWS Lambda in the form of one or more Lambda functions. Using AWS Lambda, you can even maintain multiple versions of your in-production function code, and can also create aliases for each of your function versions for easy reference.
Typically, AWS Lambda is used to run code in response to events, such as changes to data in an Amazon S3 bucket or an Amazon DynamoDB table; to run your code in response to HTTP requests using Amazon API Gateway; or invoke your code using API calls made using AWS SDKs.
In such scenarios, if the Lambda function code fails or takes too long to execute, it can stall or even completely stop data/request processing by critical AWS services (eg., Amazon S3, Amazon DynamoDB, Amazon API Gateway, etc.) that rely on that code for their operations.
This test automatically discovers the Lambda functions, monitors the invocations of each function, and in the process, reports latencies and errors/failures in function execution. This enables administrators to quickly and accurately identify slow and/or buggy functions, so that they can take those functions and their codes up for closer review and fine-tuning.
Optionally, you can configure this test to report metrics for each version of a function or for every alias of a function version. This enables administrators to quickly compare the performance of different versions or aliases of a function, and then decide which version/alias to use in the production environment.
Additionally, the test reports metrics for a Summary descriptor, using which administrators can audit/track changes to the AWS Lamba service for every region - i.e., track the addition/deletion of Lambda functions per region.
Also, the test measures the resource usage of individual functions, thus rapidly turning administrator attention to resource-hungry functions. The adequacy of the concurrency configuration of every function is also checked periodically, so that administrators can be promptly alerted to inadequacies.
Note:
This test will run and report metrics only if Amazon CloudWatch Lambda Insights is enabled in the Lambda console. Amazon CloudWatch Lambda Insights collects and aggregates Lambda function runtime performance metrics and logs for your serverless applications. To know how to enable this feature, look up
Target of the test: Amazon Cloud
Agent deploying the test : A remote agent
Outputs of the test : One set of results for each Lambda function / version / alias in every region
First-level descriptor: AWS Region
Second-level descriptor: Function / Version / Alias, depending upon the option chosen from the Lambda Filter Name parameter of this test
A few metrics are also reported for a Summary descriptor per region.
| Parameter | Description |
|---|---|
|
Test Period |
How often should the test be executed. |
|
Host |
The host for which the test is to be configured. |
|
Access Type |
eG Enterprise monitors the AWS cloud using AWS API. By default, the eG agent accesses the AWS API using a valid AWS account ID, which is assigned a special role that is specifically created for monitoring purposes. Accordingly, the Access Type parameter is set to Role by default. Furthermore, to enable the eG agent to use this default access approach, you will have to configure the eG tests with a valid AWS Account ID to Monitor and the special AWS Role Name you created for monitoring purposes.
Some AWS cloud environments however, may not support the role-based approach Note that the Secret option may not be ideal when monitoring high-security cloud environments. This is because, such environments may issue a security mandate, which would require administrators to change the Access Key and Secret Key, often. Because of the dynamicity of the key-based approach, Amazon recommends the Role-based approach for accessing the AWS API. |
|
AWS Account ID to Monitor |
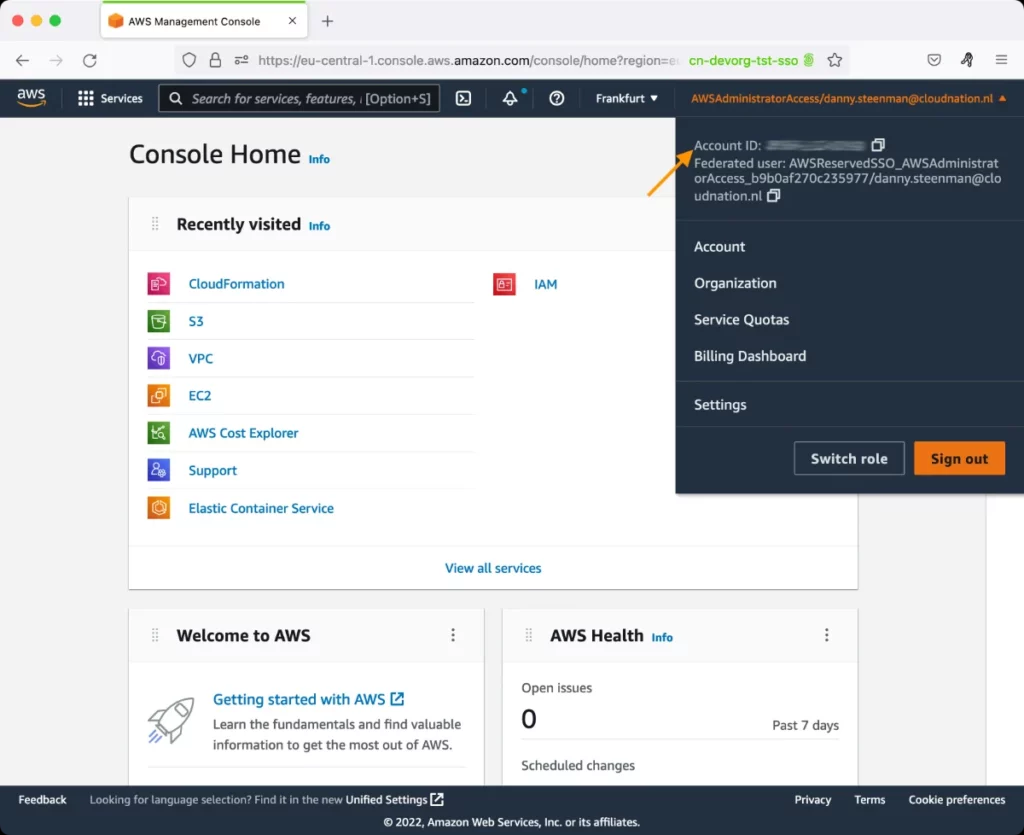
This parameter appears only when the Access Type parameter is set to Role. Specify the AWS Account ID that the eG agent should use for connecting and making requests to the AWS API. To determine your AWS Account ID, follow the steps below:
|
|
AWS Role Name |
This parameter appears when the Access Type parameter is set to Role. Specify the name of the role that you have specifically created on the AWS cloud for monitoring purposes. The eG agent uses this role and the configured Account ID to connect to the AWS Cloud and pull the required metrics. To know how to create such a role, refer to Creating a New Role. |
|
AWS Access Key, AWS Secret Key, Confirm AWS Access Key, Confirm AWS Secret Key |
These parameters appear only when the Access Type parameter is set to Secret.To monitor an Amazon cloud instance using the Secret approach, the eG agent has to be configured with the access key and secret key of a user with a valid AWS account. For this purpose, we recommend that you create a special user on the AWS cloud, obtain the access and secret keys of this user, and configure this test with these keys. The procedure for this has been detailed in the Obtaining an Access key and Secret key topic. Make sure you reconfirm the access and secret keys you provide here by retyping it in the corresponding Confirm text boxes. |
|
Proxy Host and Proxy Port |
In some environments, all communication with the AWS cloud and its regions could be routed through a proxy server. In such environments, you should make sure that the eG agent connects to the cloud via the proxy server and collects metrics. To enable metrics collection via a proxy, specify the IP address of the proxy server and the port at which the server listens against the Proxy Host and Proxy Port parameters. By default, these parameters are set to none , indicating that the eG agent is not configured to communicate via a proxy, by default. |
|
Proxy User Name, Proxy Password, and Confirm Password |
If the proxy server requires authentication, then, specify a valid proxy user name and password in the Proxy User Name and Proxy Password parameters, respectively. Then, confirm the password by retyping it in the Confirm Password text box. By default, these parameters are set to none, indicating that the proxy sever does not require authentication by default. |
|
Proxy Domain and Proxy Workstation |
If a Windows NTLM proxy is to be configured for use, then additionally, you will have to configure the Windows domain name and the Windows workstation name required for the same against the Proxy Domain and Proxy Workstation parameters. If the environment does not support a Windows NTLM proxy, set these parameters to none. |
|
Exclude Region |
Here, you can provide a comma-separated list of region names or patterns of region names that you do not want to monitor. For instance, to exclude regions with names that contain 'east' and 'west' from monitoring, your specification should be: *east*,*west* |
|
Default Connection Region |
By default, this test connects to the endpoint URL of the us-east-1 region to collect the required metrics. If the default us-east-1 region is not enabled in the target environment, then, for this test to collect the required metrics, specify the region that is enabled in the target environment. |
|
Lambda Filter Name |
By default, this parameter is set to FunctionName. This means that by default, this test will report metrics for each Lambda function that is in use. If required, you can override this default setting by setting the Lambda Filter Name parameter to one of the following:
|
|
DD For Total |
By default, this flag is set to No. This means that detailed diagnostics are not reported for the Total lambda functions measure (available only for the Summary descriptor) by default. Where numerous Lambda functions are configured, collecting and storing the details of each such function as part of detailed metrics can increase the processing overheads of the eG agent and also consume a significant amount of database space. This is why, the eG agent does not collect detailed statistics for the Total Lambda functions measure by default. However, if the eG agent has enough processing power at its disposal, and a well-sized, well-tuned eG database is in use, then you can set this flag to Yes, so that detailed diagnostics are captured for the Total Lambda functions measure. |
|
DD Frequency |
Refers to the frequency with which detailed diagnosis measures are to be generated for this test. The default is 1:1. This indicates that, by default, detailed measures will be generated every time this test runs, and also every time the test detects a problem. You can modify this frequency, if you so desire. Also, if you intend to disable the detailed diagnosis capability for this test, you can do so by specifying none against DD frequency. |
|
Detailed Diagnosis |
To make diagnosis more efficient and accurate, the eG Enterprise embeds an optional detailed diagnostic capability. With this capability, the eG agents can be configured to run detailed, more elaborate tests as and when specific problems are detected. To enable the detailed diagnosis capability of this test for a particular server, choose the On option. To disable the capability, click on the Off option. The option to selectively enable/disable the detailed diagnosis capability will be available only if the following conditions are fulfilled:
|
|
Measurement |
Description |
Measurement Unit |
Interpretation |
|---|---|---|---|
|
Invocations |
By default, this measure represents the number of times this function was invoked in response to an event or invocation API call. If the Lambda Filter Name is set to Version, then this measure represents the number of times this version of a function was invoked in response to an event or invocation API call.. If the Lambda Filter Name is set to Alias, then this measure represents the number of times this alias was invoked in response to an event or invocation API call. |
Number |
Compare the value of this measure acros functions to know which function is used the maximum. The failure of such a function will naturally have a more adverse impact on performance and productivity than other functions. |
|
Invocations failed due to errors |
By default, this measure represents the number of invocations of this function failed due to errors (response code 4xx) If the Lambda Filter Name is set to Version, then this measure represents the number of number of invocations of this version of a function that failed due to errors. If the Lambda Filter Name is set to Alias, then this measure represents the number of invocations of this alias that failed due to errors. |
Number |
Ideally, the value of this measure should be 0. A non-zero value is indicative of one/more errors in the function code. To know what errors occurred during invocation, check the logs. Typically, each time the code is executed in response to an event, it writes a log entry into the log group associated with a Lambda function, which is /aws/lambda/<function name>. Following are some examples of errors that might show up in the logs:
|
|
Dead letter errors |
By default, this measure represents the number of times Lambda could not write the failure of this function to the configured dead letter queues. If the Lambda Filter Name is set to Version, then this measure represents the number of times Lambda could not write the failure of this version of a function to the configured dead letter queues. If the Lambda Filter Name is set to Alias, then this measure represents the number of times Lambda could not write the failure of this alias to the configured dead letter queues. |
Number |
By default, a failed Lambda function invoked asynchronously is retried twice, and then the event is discarded. Using Dead Letter Queues (DLQ), you can indicate to Lambda that unprocessed events should be sent to an Amazon SQS queue or Amazon SNS topic instead, where you can take further action. If the value of this measure keeps increasing, it implies that the event payload is consistently failing to reach the dead letter queue. Probable cause for this are as follows:
|
|
Time taken to execute function |
By default, this measure indicates the average elapsed wall clock time from when this function's code starts executing because of an invocation to when it stops executing. If the Lambda Filter Name is set to Version, then this measure represents the average elapsed wall clock time from when this version of a function's code starts executing because of an invocation to when it stops executing. If the Lambda Filter Name is set to Alias, then this measure represents the average elapsed wall clock time from when this alias starts executing because of an invocation to when it stops executing. |
Secs |
Ideally, the value of this measure should be low. A high value indicates that a function/version/alias is taking too long to execute. To determine why there is increased latency in the execution of a Lambda function, do the following:
|
|
Function invocation that throttled |
By default, this measure indicates the number of invocation attempts for this Lambda function that were throttled due to invocation rates exceeding the customer’s concurrent limits (error code 429). If the Lambda Filter Name is set to Version, then this measure represents the number of invocation attempts that were throttled for this version of the Lambda function due to invocation rates exceeding the customer’s concurrent limits (error code 429). If the Lambda Filter Name is set to Alias, then this measure represents the number of invocation attempts that were throttled for the version of the function that maps to this alias, due to invocation rates exceeding the customer’s concurrent limits (error code 429). |
Number |
The unit of scale for AWS Lambda is a concurrent execution (see Understanding Scaling Behavior for more details). However, scaling indefinitely is not desirable in all scenarios. For example, you may want to control your concurrency for cost reasons, or to regulate how long it takes you to process a batch of events, or to simply match it with a downstream resource. To assist with this, Lambda provides a concurrent execution limit control at both the account level and the function level. On reaching the concurrency limit associated with a function, any further invocation requests to that function are throttled, i.e. the invocation doesn't execute your function. Each throttled invocation increases the value of this measure for the corresponding function. AWS Lambda handles throttled invocation requests differently, depending on their source:
|
|
Total Lambda functions |
Indicates the total number of Lambda functions available in this region. |
Number |
This measure is available only for the Summary descriptor. Use the detailed diagnosis of this measure, if enabled, to know which functions are available for each region, the runtime environment of each function, and when the function was last modified. Note that detailed diagnostics will be reported for this measure only if the DD For Total flag is set to Yes. |
|
Newly created functions |
Indicates the number of Lambda functions that were created in this region during the last measurement period. |
Number |
This measure is available only for the Summary descriptor. Use the detailed diagnosis of this measure to know which Lambda functions were recently created in this region. |
|
Deleted lambda functions |
Indicates the number of Lambda functions that were deleted in this region during the last measurement period. |
Number |
This measure is available only for the Summary descriptor. Use the detailed diagnosis of this measure to know which Lambda functions were recently deleted in this region. |
|
CPU total time |
By default, this measure indicates the total time for which this Lambda function used CPU for user and system-related processing. If the Lambda Filter Name is set to Alias, then this measure represents the total duration for which Lambda functions that are of a version that maps to this alias, used the CPU for user and system-related processing. If the Lambda Filter Name is set to Version, then this measure represents the total duration for which Lambda functions of this version used the CPU for user and system-related processing. |
Seconds |
Compare the value of this measure across functions to know which function was hogging the CPU. Likewise, compare the value of this measure across aliases / versions to know the functions mapped to which alias / version is hogging the CPU. |
|
Time spent in the init phase |
By default, this measure indicates the time spent by this Lambda function in the init phase of the Lambda execution environment lifecycle. If the Lambda Filter Name is set to Alias, then this measure represents the time that Lambda functions of a version mapped to this alias spent in the init phase of the Lambda execution environment lifecycle. If the Lambda Filter Name is set to Version, then this measure represents the time that Lambda functions of this version spent in the init phase of the Lambda execution environment lifecycle. |
Seconds |
In the Init phase, Lambda creates or unfreezes an execution environment with the configured resources, downloads the code for the function and all layers, initializes any extensions, initializes the runtime, and then runs the function’s initialization code (the code outside the main handler). The Init phase happens either during the first invocation, or in advance of function invocations if you have enabled provisioned concurrency. Compare the value of this measure across functions to know which function spent the maximum time in the init phase. Likewise, compare the value of this measure across aliases / versions to know the functions mapped to which alias / version were delayed in the init phase. |
|
Total memory |
Indicates the amount of memory allocated to this Lambda function. If the Lambda Filter Name is set to Alias, then this measure represents the total memory allocated to Lambda functions of versions mapped to this alias. If the Lambda Filter Name is set to Version, then this measure represents the total memory allocated to Lambda functions of this version. |
MB |
|
|
Maximum used memory
|
By default, this measure reports the maximum amount of memory used by this Lambda function. If the Lambda Filter Name is set to Alias, then this measure represents the maximum memory used by Lambda functions of a version mapped to this alias. If the Lambda Filter Name is set to Version, then this measure represents the maximum memory used by Lambda functions of this version. |
MB |
|
|
Memory utilization |
By default, this measure reports the maximum memory measured as a percentage of total memory. If the Lambda Filter Name is set to Alias, then this measure represents the percentage of maximum memory used by Lambda functions of a version mapped to this alias. If the Lambda Filter Name is set to Version, then this measure represents the percentage of maximum memory used by Lambda functions of this version. |
Percent |
Compare the value of this measure across functions to know which function used the maximum amount of memory. Likewise, compare the value of this measure across aliases/versions to understand if functions of a specific version are memory-hungry. |
|
Data reads |
By default, this measure reports the amount of data read by this Lambda function. If the Lambda Filter Name is set to Alias, then this measure represents the amount of data read by Lambda functions of a version mapped to this alias. If the Lambda Filter Name is set to Version, then this measure represents the amount of data read by Lambda functions of this version. |
KB |
|
|
Data writes |
By default, this measure reports the amount of data written by this Lambda function. If the Lambda Filter Name is set to Alias, then this measure represents the amount of data written by Lambda functions of a version mapped to this alias. If the Lambda Filter Name is set to Version, then this measure represents the amount of data written by Lambda functions of this version. |
|
|
|
Network throughput |
By default, this measure reports the sum of data reads and writes for this Lambda function. If the Lambda Filter Name is set to Alias, then this measure represents the total amount of data read and written by all Lambda functions of a version mapped to this alias. If the Lambda Filter Name is set to Version, then this measure represents the total amount of data read and written by all Lambda functions of this version. |
KB |
Compare the value of this measure across Lambda functions to know which function is I/O-intensive. You can also compare the value of this measure across aliases/versions to determine if Lambda functions of any specific alias/version are consistently I/O-intensive. |
|
Post runtime extensions duration |
By default, this measure reports the cumulative amount of time that the runtime of this Lambda function spends running code for extensions after the function code has completed. If the Lambda Filter Name is set to Alias, then this measure represents the cumulative amount of time that all Lambda functions mapped to this alias spend running code for extensions after the function code has completed. If the Lambda Filter Name is set to Version, then this measure represents the cumulative amount of time that all Lambda functions of this version spend running code for extensions after the function code has completed. |
Seconds |
Compare the value of this measure across Lambda functions to know which function's runtime is spending more time running code for extensions. You can also compare the value of this measure across aliases/versions to determine if Lambda functions of any specific alias/version are spending more time running code for extensions.
|
|
Concurrent executions |
By default, this measure reports the number of instances of this function that are concurrently processing events. If the Lambda Filter Name is set to Alias, then this measure represents the number of instances of Lambda functions mapped to this alias that are concurrently processing events. If the Lambda Filter Name is set to Version, then this measure represents the number of instances of Lambda functions of this version that are concurrently processing events |
Number |
Concurrency is the number of requests that your function is serving at any given time. When your function is invoked, Lambda allocates an instance of it to process the event. When the function code finishes running, it can handle another request. If the function is invoked again while a request is still being processed, another instance is allocated, which increases the function's concurrency. The total concurrency for all of the functions in your account is subject to a per-region quota. For an initial burst of traffic, your functions' cumulative concurrency in a region can reach an initial level of between 500 and 3000, which varies per region. You can also allocate capacity on a per-function basis with Reserved concurrency. This guarantees the maximum number of concurrent instances for the function. When a function has reserved concurrency, no other function can use that concurrency. Alternatively, you can configure Provisioned concurrency for a function. This initializes a requested number of execution environments so that they are prepared to respond immediately to your function's invocations. By observing the variations to this measure for each function over time, you can quickly isolate functions requiring more concurrency capacity. You can then allocate the additional capacity to that function by setting Reserved concurrency or Provisioned concurrency. |
|
Destination delivery failures |
By default, this measure reports the number of times this Lambda function attempted to send an event to a destination but failed. If the Lambda Filter Name is set to Alias, then this measure represents the number of times functions mapped to this alias attempted to send an event to a destination but failed. If the Lambda Filter Name is set to Version, then this measure represents the number of times functions of this version attempted to send an event to a destination but failed. |
Number |
Ideally, the value of this measure should be 0 for any function/alias/version. A non-zero value is a cause for concern, as it implies that a Lambda function or functions mapped to an alias/version (as the case may be) failed to send an event to a destination. Delivery errors can occur due to permissions errors, misconfigured resources, or size limits.. |
|
Provisioned concurrency invocations |
By default, this measure reports the number of times this function's code is executed on provisioned concurrency. If the Lambda Filter Name is set to Alias, then this measure represents the number of times functions mapped to this alias were executed on provisioned concurrency. If the Lambda Filter Name is set to Version, then this measure represents the number of times functions of this version were executed on provisioned concurrency. |
Number |
Provisioned Concurrency is a feature that keeps functions initialized and hyper-ready to respond in double-digit milliseconds. This is ideal for implementing interactive services, such as web and mobile backends, latency-sensitive microservices, or synchronous APIs. When you invoke a Lambda function, the invocation is routed to an execution environment to process the request. When a function has not been used for some time, when you need to process more concurrent invocations, or when you update a function, new execution environments are created. The creation of an execution environment takes care of installing the function code and starting the runtime. Depending on the size of your deployment package, and the initialization time of the runtime and of your code, this can introduce latency for the invocations that are routed to a new execution environment. This latency is usually referred to as a “cold start”. For most applications this additional latency is not a problem. For some applications, however, this latency may not be acceptable. When you enable Provisioned Concurrency for a function, the Lambda service will initialize the requested number of execution environments so they can be ready to respond to invocations. |
|
Provisioned concurrency spillover invocations |
By default, this measure reports the number of times this function's code was executed on standard concurrency when all provisioned concurrency is in use. If the Lambda Filter Name is set to Alias, then this measure represents the number of times functions mapped to this alias were executed on standard concurrency when all provisioned concurrency is in use. If the Lambda Filter Name is set to Version, then this measure represents the number of times functions of this version were executed on standard concurrency when all provisioned concurrency is in use. |
Number |
If the value of this measure is consistently high for any function, it could indicate that the function has outgrown its provisioned concurrency capacity. You may then want to allocate more concurrency capacity to that function by fine-tuning its Provisioned concurrency setting. |
|
Provisioned concurrent executions |
By default, this measure reports the number of instances of this function that are processing events on provisioned concurrency. If the Lambda Filter Name is set to Alias, then this measure represents the number of instances of functions mapped to this alias that are processing events on provisioned concurrency. If the Lambda Filter Name is set to Version, then this measure represents the number of instances of functions of this version that are processing events on provisioned concurrency. |
Number |
|
|
Provisioned concurrency utilization |
By default, this measure reports the percentage of allocated Provisioned concurrency capacity that is currently in use. |
Percent |
A value close to 100% for any function indicates that the concurrency capacity configured for that function is inadequate. In such cases, a spill over becomes inevitable. To avoid this, you may want to consider increasing the Provisioned Concurrency capacity for that function. Optionally, you may want to configure Reserved Concurrency for that function, as it guarantees the maximum number of concurrent instances. |
|
Unreserved concurrent executions |
By default, this measure reports the number of events that are being processed by functions that do not have reserved concurrency. |
Number |
This measure is only reported for a Summary descriptor. |