Node.js CPU Usage Test
CPU contention is one of the reasons that affects the performance of the target Node.js application server. To avoid excessive CPU utilization, administrators must track the CPU usage of each Node.js application server instance over a period of time, proactively detect potential CPU contentions, and accurately isolate what is causing excessive CPU usage on each server instance - system processes? or user processes? This can be achieved using the Node.js CPU Usage test.
This test auto-discovers the instances of the target Node.js V8 Engine and for each instance, this test reports the time spent in system level processing and user level processing. This test also alerts administrators to erratic CPU usage patterns on each instance. The detailed diagnostics of this test reveals the top 10 functions that are CPU intensive. This way, the test helps administrators isolate and pre-empt CPU contentions on each instance, and initiate troubleshooting at the earliest.
Target of the test : A Node.js V8 Engine
Agent deploying the test : An internal agent
Outputs of the test : One set of results for every instance of the target Node.js server being monitored
| Parameter | Description |
|---|---|
|
Test Period |
How often should the test be executed. |
|
Host |
The IP address of the host for which this test is to be configured. |
|
Port |
The port at which the target Host listens to. By default this is 3000. |
|
Top N Function Details |
By default, this parameter is set to 10. This indicates that the detailed diagnostics of this test will report the top 10 functions that are CPU intensive, by default. If required, you can increase or decrease the value of this parameter to view detailed metrics for more or less number of functions. |
|
DD Frequency |
Refers to the frequency with which detailed diagnosis measures are to be generated for this test. The default is 1:1. This indicates that, by default, detailed measures will be generated every time this test runs, and also every time the test detects a problem. You can modify this frequency, if you so desire. Also, if you intend to disable the detailed diagnosis capability for this test, you can do so by specifying none against DD frequency. |
|
Detailed Diagnosis |
To make diagnosis more efficient and accurate, the eG Enterprise embeds an optional detailed diagnostic capability. With this capability, the eG agents can be configured to run detailed, more elaborate tests as and when specific problems are detected. To enable the detailed diagnosis capability of this test for a particular server, choose the On option. To disable the capability, click on the Off option. The option to selectively enable/disable the detailed diagnosis capability will be available only if the following conditions are fulfilled:
|
| Measurement | Description | Measurement Unit | Interpretation |
|---|---|---|---|
|
User code CPU |
Indicates the percentage of CPU time this instance spent in user-level processing. |
Percent |
An unusually high value indicates a problem and may be due to too many user-level tasks / functions executing simultaneously. The detailed diagnosis of this measure lists the top 10 user-level functions that are executing simultaneously and are consuming excessive CPU resources, the javascript file path of each function, the time taken by each function, the total time and the percentage of time taken by each function. |
|
System code CPU |
Indicates the percentage of CPU time this instance spent in system-level processing. |
Percent |
An unusually high value indicates a problem and may be due to too many system-level tasks / functions executing simultaneously. |
|
User code CPU TIME |
Indicates the time spent by this instance in user-level processing. |
Milliseconds |
Compare the value of this measure across instances to identify the instance that is consuming too much of time in user-level processing. |
|
System code CPU TIME |
Indicates the time spent by this instance in system-level processing. |
Milliseconds |
Compare the value of this measure across instances to identify the instance that is consuming too much of time in system-level processing. |
|
Process ID |
Indicates the PID of the process executing on the CPU of this instance. |
Number |
|
|
Number of worker processes |
Indicates the number of worker processes executing on the CPU of this instance. |
Number |
|
The detailed diagnosis of the User code CPU measure lists the top 10 user-level functions that are executing simultaneously and are consuming excessive CPU resources. Administrators can identify the caller function that is responsible for such excessive CPU utilization and the exact file path of the caller function.
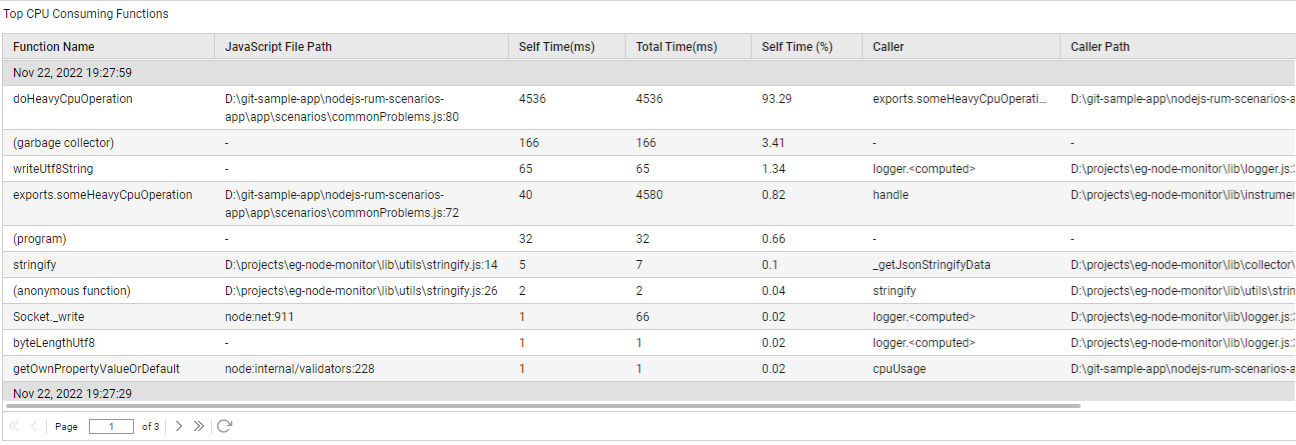
Figure 1 : The detailed diagnosis of the User code CPU measure