How does the eG PHP Profiler Work?
Figure 1 depicts how the eG PHP Profiler works. The eG agent installed on the PHP server is bundled with an installer for the eG PHP profiler. When run, this installer installs the PHP profiler in the Zend engine. The Zend Engine is the open source scripting engine that interprets the PHP programming language. (This is similar to a Java JVM.)
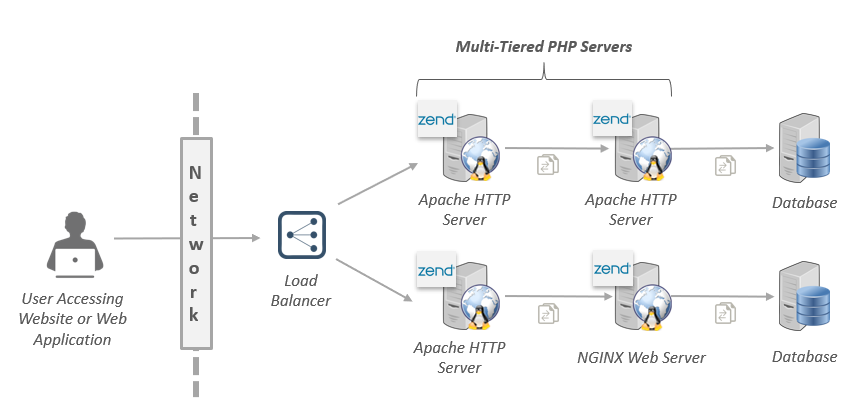
Figure 1 : How does the eG PHP Profiler work?
If more PHP servers are in the transaction path, then, the profiler will have to be installed on each of these servers, for end-to-end visibility.
The profiler then injects a code into the PHP application code. The injected code adds a GUID to each unique transaction to the application, and performs the following tasks:
- Traces the path of a transaction;
- Measures the responsiveness of a transaction by computing the time difference between when the transaction started and when it ended;
- Identifies the slow, stalled, and error transactions, and computes the count of such transactions;
- Discovers the exit calls made by a transaction from the PHP server, determines the destination of the calls, and measures the average time taken by each call to process the requests for a transaction;
The profiler then sends all these statistics to the eG agent.
The eG agent reports these metrics to the eG manager. The eG manager associates these metrics with the Web Transactions layer of the target PHP web server (typically, this will be an Apache web server or an NGINX web server), and displays them in the eG monitoring console.