Monitoring the RHEV Hypervisor
As already mentioned, the RHEV Hypervisor model can be used where the VMs on the RHEV Hypervisor support critical server applications such as Web server, database server, mail server, etc.
Figure 1 depicts the monitoring model of the RHEV Hypervisor.
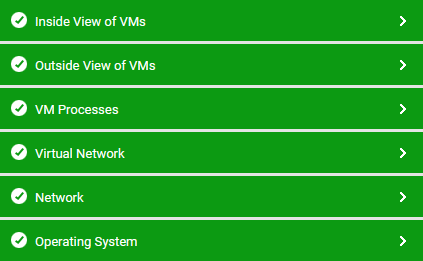
Figure 1 : The layer model of the RHEV Hypervisor
Each layer of Figure 1 is mapped to a wide variety of tests that report a wealth of performance tests using which administrators can find quick and accurate answers to the following performance queries:
-
What is the CPU load on the RHEV server and each of the VMs?
-
What is the free physical memory in the RHEV server and which VM is contributing to the memory usage?
-
Which network interfaces of the RHEV server are seeing the most traffic?
-
How many VMs are running? What are their IP addresses/host names and operating systems?
-
How many virtual CPUs are allocated to each VM?
-
What portion of the physical server's CPU is used by each VM?
-
How much memory is configured for each VM? What percentage of the configured memory is each VM consuming?
-
How many disk reads and writes are being initiated by each VM?
-
How much network traffic is being generated by every VM?
-
What percentage of the physical CPU allocated to a VM is being used by the processes running on the VM?
-
Which processes running in the VM are responsible for the resource usage (CPU, memory, disk) of the VM?
-
Do all the disk partitions in the VM operating system have adequate space?
-
Is there excessive queuing for disk access on any VM operating system? Which applications could be causing these excessive accesses?
-
Are all critical Windows services running in the VM operating system?
-
At what times of the day was the VM rebooted?
-
Is any process running in the VM leaking memory or handles?