Monitoring the Microsoft SQL Integration Server
As mentioned earlier, eG Enterprise provides a specialized model for monitoring SSIS (see Figure 8).
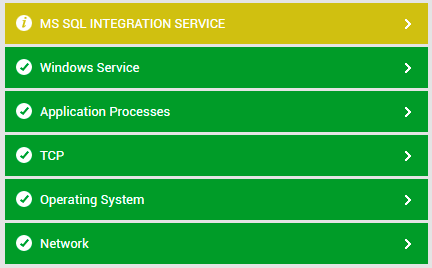
Figure 8 : Layer model of the Microsoft SQL Integration Server
Each layer of Figure 8 above is mapped to tests that report a variety of metrics revealing the status of packages, latencies in package execution, and the efficiency of the data flow engine. Using these metrics, administrators can find quick and accurate answers to the following performance queries:
- Is the data flow engine consuming buffer memory excessively? Is this memory drain increasing memory swapping between the RAM and storage?
- Did any package fail to execute? If so, which one failed? Which project is the failed package associated with?
- Are too many packages pending execution? If so, which ones?
- Are there any packages that stopped executing abruptly/unexpectedly? If so, which ones are they?
- Were any packages cancelled?
- How many packages are executing simultaneously? Is the server configured with adequate number of threads to handle this concurrent package load?
- Is any package executing slowly? If so, which package is it? Which component in the package is contributing to this slowness?
- Were any errors/warnings observed in SSIS operations? If so, what are they, and which packages were affected?
- Did any tasks fail? If so, which tasks failed, and which packages were impacted by the failure?