Custom Capacity Analysis Report
The eG Reporter module offers a wide variety of reports using which one can cross-correlate and time-correlate across thousands of metrics collected from across the environment. Reports generated using trend data particularly can accurately reveal the past load and performance trends, using which future trends in load and usage can be determined. The Avg, Sum, Max, and Min values computed by the eG Enterprise system on an hourly basis as part of its trend computations, help a great deal in determining potential sizing inadequacies and planning the future capacity of the environment. However, from a strict capacity planning perspective, Percentile values are deemed as more effective pointers to capacity inadequacies than the avg, sum, max, and min values. To enable users to effectively plan the capacity of their environment, eG Enterprise allows administrators to configure the trend manager to compute percentile values, and then generate a Custom report using the computed percentiles.
To generate a Custom report, do the following:
- Login to eG Reporter.
- Select the Custom Capacity Analysis option from the Capacity Planning node of the REPORTS BY FUNCTION tree.
-
Figure 1 will then appear where you need to configure the test for which the custom capacity planning report needs to be generated.
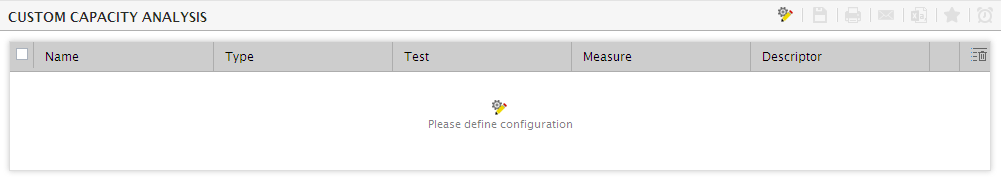
Figure 1 : The Custom Capacity Analysis report before configuration
-
Clicking on the Please define configuration link in Figure 1 will lead you to Figure 2 using which you can configure the tests for which the Custom Capacity Analysis report needs to be generated.
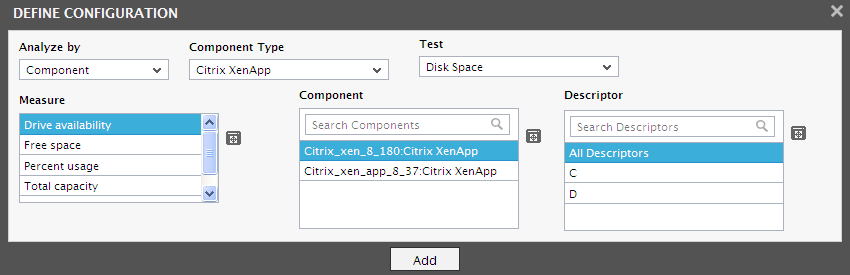
Figure 2 : Defining the tests for generating the Custom Capacity Analysis reports
-
Pick a criterion for analysis from the Analyze by list. Using this report, you can analyze the capacity of independent components and those that are part of a segment, service, or a zone. The options provided by the Analyze by list box are discussed hereunder:
- Component: Select this option to choose the component(s) from across all the managed components in the environment.
- Service: Select this option if the components for which a report is to be generated are involved in the delivery of a business service. Then, select a Service.
- Segment: Choose this option if the components for which this report is to be generated are part of a segment. Then, pick a Segment for analysis.
- Zone: Pick this option for a capacity planning report for components that are part of a zone. Then, choose a Zone. Also, indicate whether the components within the sub-zones of the chosen zone are also to be to be considered for report generation, by selecting an option from the Include subzone list.
- Based on the criterion chosen from the Analyze by list, the Component Type list will be populated. Select a component type for which the report is to be generated.
- Of the tests associated with the chosen component-type, select the Test to which this report should pertain.
- From the Measure list, choose the measures for which this report is to be generated. If too many measures are listed here, then viewing all the measures and selecting the ones you need for report generation could require endless scrolling. To avoid this, you can click the
 icon next to the Measure list. The MEASURES pop up window will then appear using which you can view almost all the measures in a single interface and select the ones for which the report is to be generated.
 - All components of the chosen type spread across the environment, or which are within a chosen segment / service / zone (based on the Analyze by selection) will be listed in the Component list. Pick the components for which the report is to be generated. If the Component list consists of too many components, then viewing all the components and selecting the ones you need for report generation could require endless scrolling. To avoid this, you can click the icon next to the Component list. The COMPONENT pop up window will then appear using which you can view almost all the components in a single interface and select the ones for which the report is to be generated.
-
Select the descriptors of interest from the Descriptor list;to include all descriptors in the analysis, select the All Descriptors option. If the Descriptor list consists of too many descriptors, then viewing all the descriptors and selecting the ones you need for report generation could require endless scrolling. To avoid this, you can click the
icon next to the Descriptor list. The DESCRIPTOR pop up window will then appear using which you can view almost all the descriptors in a single interface and select the ones for which the report is to be generated.Note:
The Descriptorlist will be populated with descriptors only if a single component is chosen from the Component list. If multiple components are chosen, no descriptors will be displayed here for selection. The Descriptorlist will be populated with descriptors only if a single component is chosen from the Component list. If multiple components are chosen, no descriptors will be displayed here for selection.
-
Then, click the Add button in Figure 3. The specification that you built will be added as shown in Figure 3. Similarly, multiple specifications can be added. To remove a specification, simply select the check box corresponding to that row in the box, and click the
 button. To remove all specifications listed in the box, just select the check box before the column head Name so that, all listed specifications are marked for deletion;then, click the icon.
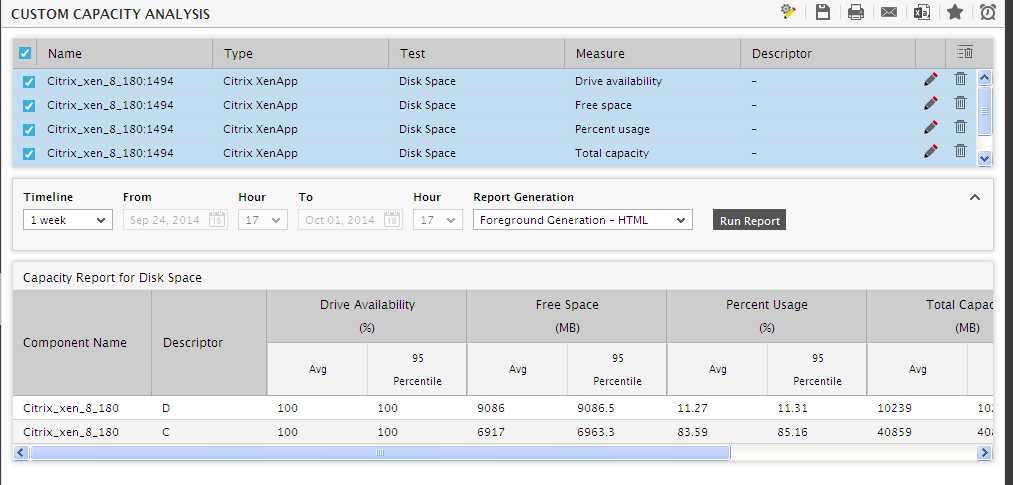
-
If your specification includes one or more descriptors, you can modify your specification by clicking the
 button. Figure 4 will then appear.
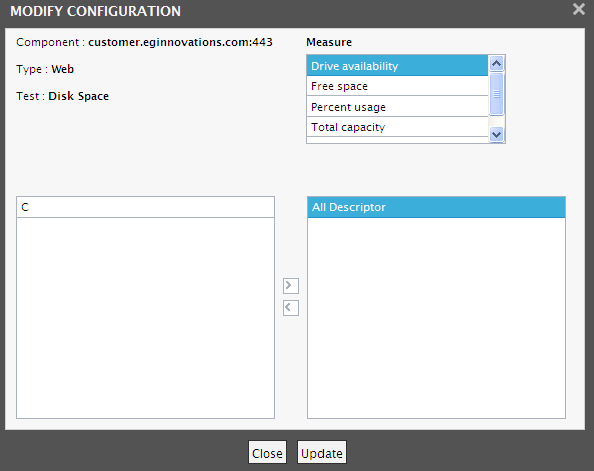
- To add more descriptors, select one/more options from the Excluded Descriptors list in Figure 4 and click the > button. To remove descriptors, select one/more options from the Included Descriptors list and click the < button. Finally, click the Update button.
- Also, the Measure list in Figure 4 will display all the measures for the chosen test, and will indicate which ones have been chosen for report generation. If you want to exclude one/more measures, simply deselect the measures from the Measure list, and finally, click the Update button.
- This will lead you back to the report page.
- Provide a Timeline for the report (see Figure 3).
-
In large environments, reports generated using months of data can take a long time to complete. Administrators now have the option of generating reports on-line or in the background. When a report is scheduled for background generation, administrators can proceed with their other monitoring, diagnosis, and reporting tasks, while the eG manager is processing the report. This saves the administrator valuable time. To schedule background processing of a report, you can either select the Background Save - PDF option or the Background Save - CSV option from the Report Generation list. In this case, a Report Name text box will appear, where you would have to provide the name with which the report is to be saved in the background. To process reports in the foreground, select the Foreground Generation - HTML option from this list.
Note:
- The Report Generation list will appear only if the EnableBackgroundReport flag in the [BACKGROUND_PROCESS] section of the eg_report.ini file (in the [EG_INSTALL_DIR]\manager\config directory) is set to Yes.
- The default selection in the Report Generation list will change according to the Timeline specified for the report. If the Timeline set is greater than or equal to the number of days specified against the MinDurationForReport parameter in the [BACKGROUND_PROCESS] section of the eg_report.ini file, then the default selection in the Report Generation list will be Background Save - PDF. On the other hand, if the Timeline set for the report is lesser than the value of the MinDurationForReport parameter, then the default selection in the Report Generation list will be Foreground. This is because, the MinDurationForReport setting governs when reports are to be processed in the background. By default, this parameter is set to 2 weeks - this indicates that by default, reports with a timeline of 2 weeks and above will be processed in the background.
- Finally, click the Run Report button to generate the report.
-
If the Foreground Generation - HTML option is chosen from the Report Generation list, then, Figure 5 will appear as soon as the Run Report button is clicked.
- For each component, measure, and descriptor chosen earlier, this report will display the Avg value recorded by the chosen measure over a period of time, as also the Percentile value associated with the measure. Using this report, you can easily understand the variations in the behavior of the measure over time, and accordingly plan the future capacity of the application/system.
-
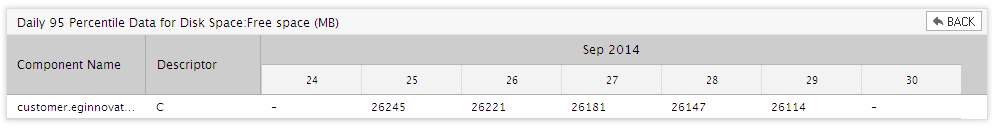
Clicking on an Avg or a Percentile value that corresponds to a measure will lead you to Figure 6 If the Timeline of the original reports spans a day, then Figure 6 will provide an hourly breakup of the Percentile computations for the corresponding measure-descriptor combination so that, you can isolate the exact hour at which the resource usage was abnormally high. Likewise, if the Timeline of the report spans days, then Figure 6 will provide a day-wise breakup of the Percentile computations. In the same way, a Timeline specification that runs across months will result in a Figure 6 that will provide a monthly breakup of the Percentile calculations.
- If the Background Save - PDF option is chosen from the Report Generation list, then clicking on the Run Report button will not generate the report and display it in this page for your benefit. Instead, a message indicating that the report is being processed in the background will appear. This will be accompanied by a link that will lead you to the page that lists all the reports that are being processed in the background, and their current status. If background report generation fails for a report, you can regenerate that report using this page, or can even delete that report if need be. On the other hand, if background processing successfully completes for your report, then, you can view a PDF of the report by clicking on the
 icon in that page.