Tuxedo PIA Client Connections Test
Monitoring the clients that are communicating with the Tuxedo application server domain and their experience with the domain, will accurately point administrators to clients who are imposing the maximum load on the domain and the clients whose experience with the domain is below-par. This is exactly what the Tuxedo PIA Client Connections test does. This test automatically discovers the clients who are currently connected to the server domain, reports the number of active sessions for each client, and also reveals the number of transactions of every client that have been committed and aborted. In the process, the test pinpoints those clients who have launched too many sessions on the domain; in the event that the server domain chokes, such clients could be considered guilty of overloading the domain. Additionally, the test reveals which client’s transactions were aborted often, rendering such clients unable to complete their transactions; this in turn may disrupt the business flow and adversely impact experience with the server domain.
Target of the test : A Tuxedo Application Server
Agent deploying the test : An internal agent
Outputs of the test : One set of results for every client currently connected to the server domain being monitored.
| Parameter | Description |
|---|---|
|
Test period |
How often should the test be executed |
|
Host |
The host for which the test is to be configured. |
|
Port |
The port number at which the specified Host listens to. By default, this will be 12345. |
|
PSAdmin Home |
To collect metrics from a Tuxedo application server, this test runs PeopleSoft Server Administration (PSADMIN) commands on the target server. The first step towards this is to launch the psadmin.exe. To enable the test to run the psadmin.exe, you need to configure the test with the full path to the directory in which the psadmin.exe resides. Therefore, in the PSAdmin Home text box, specify the location of the psadmin.exe. Typically, this will be the install directory of the Tuxedo application server. For instance, on Windows, your specification can be C:\ps\appsrv and on Unix, your specification can be: opt/ps/appsrv. |
|
Domain |
An application server Domain is the collection of server processes, supporting processes, and resource managers that enable connections to the database. A single application server machine can support multiple application server domains running on it. A server process is executable code that receives incoming transaction requests. The server process carries out a request by making calls to a service. Using a managed Tuxedo application server, you can monitor only those server processes and transactions that pertain to a single domain. This is why, the eG agent needs to be explicitly configured with the application server Domain it needs to monitor. |
|
Detailed Diagnosis |
To make diagnosis more efficient and accurate, the eG Enterprise embeds an optional detailed diagnostic capability. With this capability, the eG agents can be configured to run detailed, more elaborate tests as and when specific problems are detected. To enable the detailed diagnosis capability of this test for a particular server, choose the On option. To disable the capability, click on the Off option. The option to selectively enable/disable the detailed diagnosis capability will be available only if the following conditions are fulfilled:
|
| Measurement | Description | Measurement Unit | Interpretation |
|---|---|---|---|
|
Number of clients |
Indicates the number of sessions currently active for this client. |
Number |
This is a good indicator of the workload currently imposed by a client on the application server domain. In the event of an overload, you can compare the value of this measure across clients to know which client is contributing to the overload by launching many sessions on the domain. You can also use the detailed diagnosis of this measure to know which users are communicating with the application server domain via the client, the duration of each user’s session with the domain, and the current status of the session. With the help of this information, administrators can in no time isolate those sessions that are idle, but are unnecessarily consuming resources and adding to the server load. By closing such sessions, administrators can conserve server resources and reduce load. |
|
Average begins |
Indicates the average number of transactions started by this client. |
Number |
|
|
Average commits |
Indicates the average number of transactions committed by this client. |
Number |
|
|
Average aborts |
Indicates the average number of transactions of this client that were aborted. |
Number |
Ideally, the value of this measure should be low. A high value could indicate the incidence of many transactional errors that are causing the transactions to abort. You may want to compare the value of this measure across clients to know which client’s transactions aborted the most, thus leading administrators to those clients who may not have had a good experience with the server. |
The detailed diagnosis of the Number of clients measure reveals the users who are communicating with the app server domain, the duration of each user’s session with the domain, and the current status of the session. Idle sessions can thus be identified and their impact on resource consumption can be assessed.
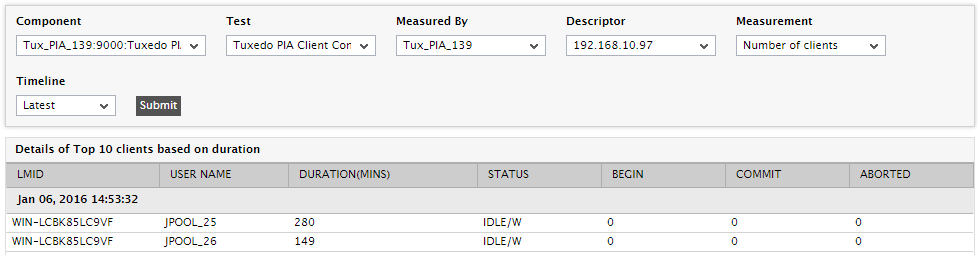
Figure 1 : Detailed diagnosis of the Tuxedo PIA Client Connections test