eG Database Tables Test
This test monitors the tables in the eG database and turns the spotlight on the following:
- Large sized tables in terms of the volume of data they store;
- Tables with too many rows of data;
- Tables that are badly structured - i.e., tables without index or tables without primary key
Target of the test : The eG Manager
Agent deploying the test : An internal/remote agent
Outputs of the test : One set of results for the eG manager being monitored
| Parameter | Description |
|---|---|
|
Test period |
How often should the test be executed . |
|
Host |
The host for which the test is to be configured. |
|
Port |
The port number at which the specified host listens. |
|
JMX Remote Port |
Here, specify the port at which the JMX listens for requests from remote hosts. In the <EG_MANAGER_INSTALL_DIR>\manager directory (on Windows; on Unix, this will be the /opt/egurkha/manager directory) of the eG manager, you will find a management.properties file. Set the port defined against the com.sun.management.jmxremote.port parameter of the file as the JMX Remote Port. |
|
User, Password, and Confirm Password |
By default, JMX requires no authentication or security. Therefore, the User, Password , and Confirm Password parameters are set to none by default. |
|
JNDIName |
The JNDIName is a lookup name for connecting to the JMX connector. By default, this is jmxrmi. If you have registered the JMX connector in the RMI registry using a different lookup name, then you can change this default value to reflect the same. |
|
JMX Provider |
This test uses a JMX Provider to access the MBean attributes of the eG manager and collect metrics. Specify the package name of this JMX Provider here. By default, this is set to com.sun.jmx.remote.protocol. |
|
Timeout |
Specify the duration (in seconds) for which this test should wait for a response from the eG manager. If there is no response from the eG manager beyond the configured duration, the test will timeout. By default, this is set to 240 seconds. |
|
Maximum Table Size |
Specify the maximum size limit (in KB) that a table should exceed in order to be counted as a high volume table. |
|
Maximum Table Size |
Specify the minimum size limit (in KB) that a table should fall below in order to be counted as a low volume table. |
|
Maximum Row Size |
This test reports all tables with more number of rows than the row limit specified here as Tables with many rows. |
|
Minimum Row Size |
This test counts reports tables with less number of rows than the row limit specified here as Tables with few rows. |
|
Detailed Diagnosis |
To make diagnosis more efficient and accurate, the eG Enterprise embeds an optional detailed diagnostic capability. With this capability, the eG agents can be configured to run detailed, more elaborate tests as and when specific problems are detected. To enable the detailed diagnosis capability of this test for a particular server, choose the On option. To disable the capability, click on the Off option. The option to selectively enable/disable the detailed diagnosis capability will be available only if the following conditions are fulfilled:
|
| Measurement | Description | Measurement Unit | Interpretation |
|---|---|---|---|
|
Database Size |
Indicates the total size of the eG database. |
MB |
|
|
Total tables |
Indicates the total number of tables that currently exist in the eG database. |
Number |
|
|
Default tables |
Indicates the number of default tables in the eG database.
|
Number |
|
|
Dynamic tables |
Indicates the number of dynamic tables currently present in the eG manager database. |
|
Dynamic tables are typically a set of virtual tables used to record current database activity. |
|
Tables without primary key |
Indicates the number of tables without a primary key. |
Number |
The purpose of a primary key is to uniquely identify each record in a table. An index on the other hand, is an alphabetical listing of the terms found on database records and the number of records on which the terms are found. A database table can survive without a primary key or an index, but this deters the whole purpose of a database: the easy retrieval of information. To know which tables do not have an index or a primary key, use the detailed diagnosis of this measure. |
|
Tables without index |
Indicates the number of tables without an index. |
Number |
|
|
Newly created tables |
Indicates the number of tables created in the eG database since the last measurement period. |
Number |
New tables will be created in the eG database as and when new components are monitored in the environment. |
|
Active sessions |
Indicates the number of active sessions to the eG backend. |
Number |
This is a good indicator of the current load on the eG database. Use the detailed diagnosis of this measure to view the hosts from which the active sessions originated. |
|
Inactive sessions |
Indicates number of currently inactive sessions to the eG database. |
Number |
Open, but inactive sessions are serious resource drains. Use the detailed diagnosis of this measure to view the hosts that are responsible for initiating the inactive sessions, determine the reason for the inactivity, and if found necessary, terminate the sessions in order to protect the database from abuse. |
|
Tables with highest volume of data |
Indicates the number of tables that contain a high data volume. |
Number |
This measure value includes all tables that are of a size greater than the Maximum Table Size configured for this test. Use the detailed diagnosis to identify the large sized tables. |
|
Tables with lowest volume of data |
Indicates the number of tables that contain a low data volume. |
Number |
This measure value includes all tables that are of a size lesser than the Minimum Table Size configured for this test. Use the detailed diagnosis to identify the small sized tables. |
|
Tables with many rows |
Indicates the number of tables with many rows. |
Number |
This measure value includes all tables with more number of rows than the Maximum Row Size configured for this test. Use the detailed diagnosis to identify the tables with too many rows. |
|
Tables with few rows |
Indicates the number of tables with few rows. |
Number |
This measure value includes all tables with less number of rows than the Minimum Row Size configured for this test. Use the detailed diagnosis to identify the tables with only a few rows. |
The detailed diagnosis of the Tables with highest volume of data measure displays all the tables with high data volume, and reports the current size of each table.
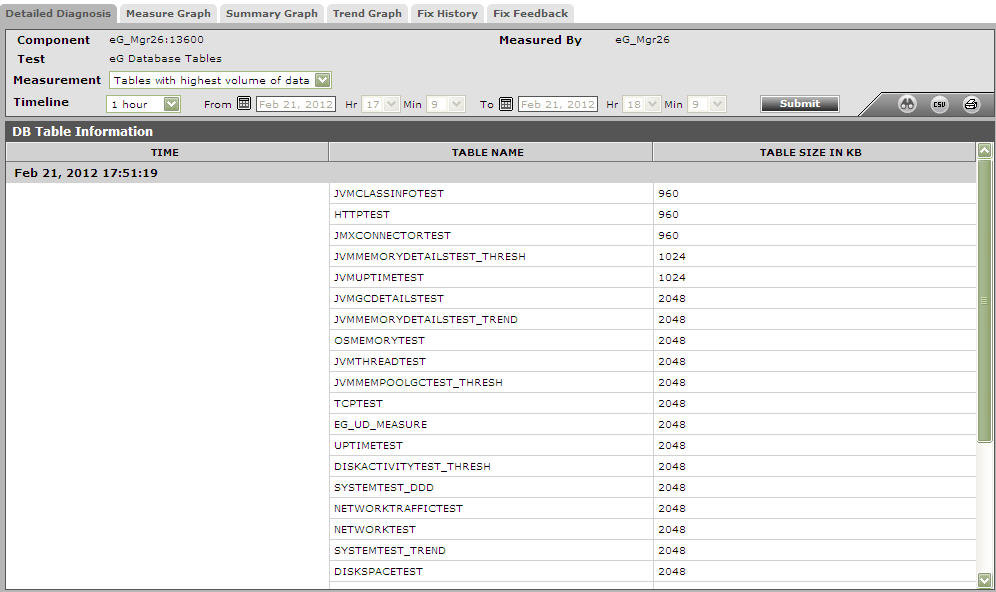
Figure 1 : The detailed diagnosis of the Tables with highest volume of data measure
The detailed diagnosis of the Tables with lowest volume of data measure displays all the tables with low data volume, and reports the current size of each table.
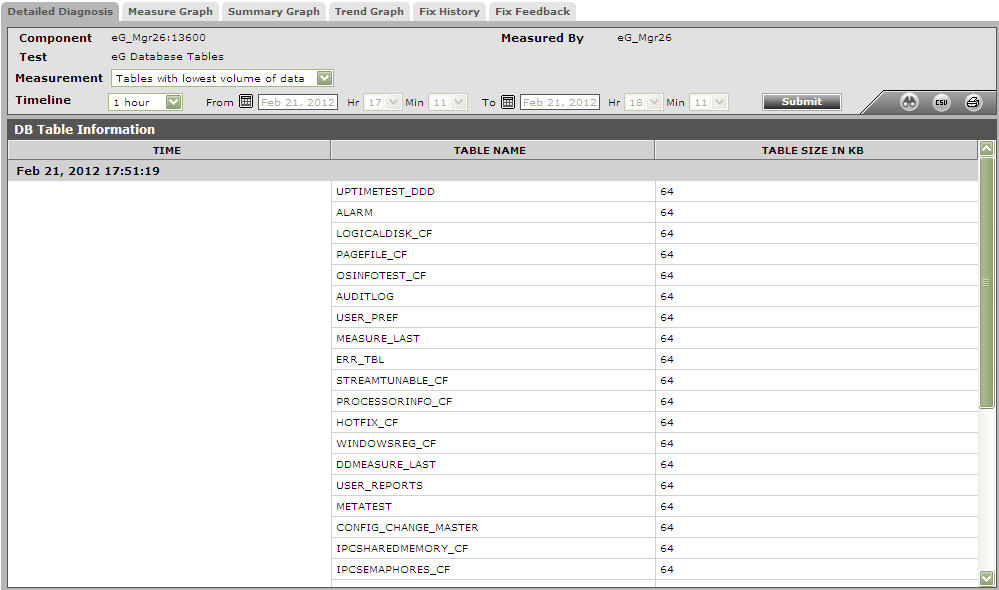
Figure 2 : The detailed diagnosis of the Tables with lowest volume of data measure
The detailed diagnosis of the Tables with many rows measure displays all the tables with many rows, and the number of rows in each table.
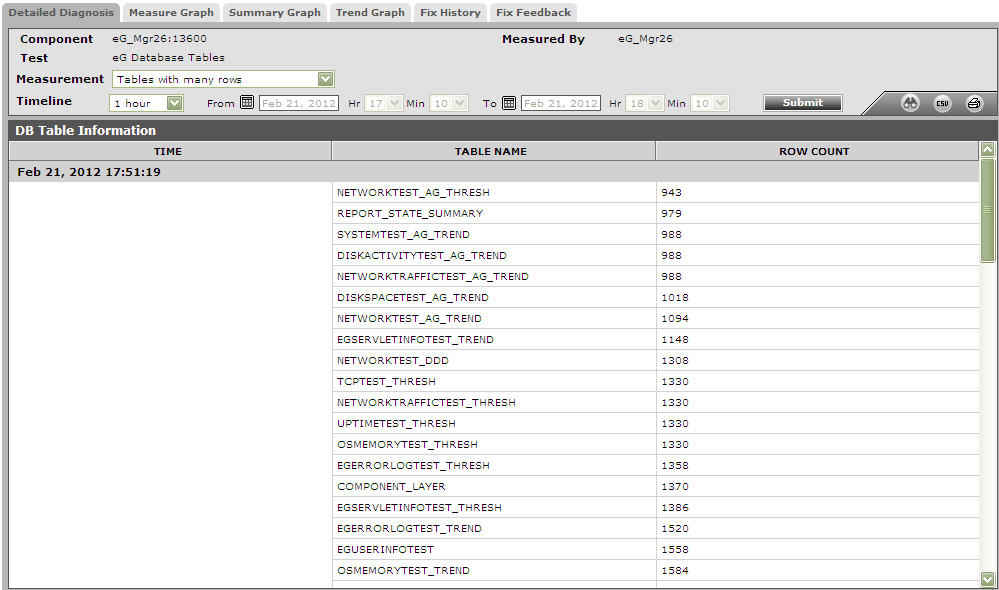
Figure 3 : The detailed diagnosis of the Tables with many rows measure
The detailed diagnosis of the Tables with few rows measure displays all the tables with few rows, and the number of rows in each table.
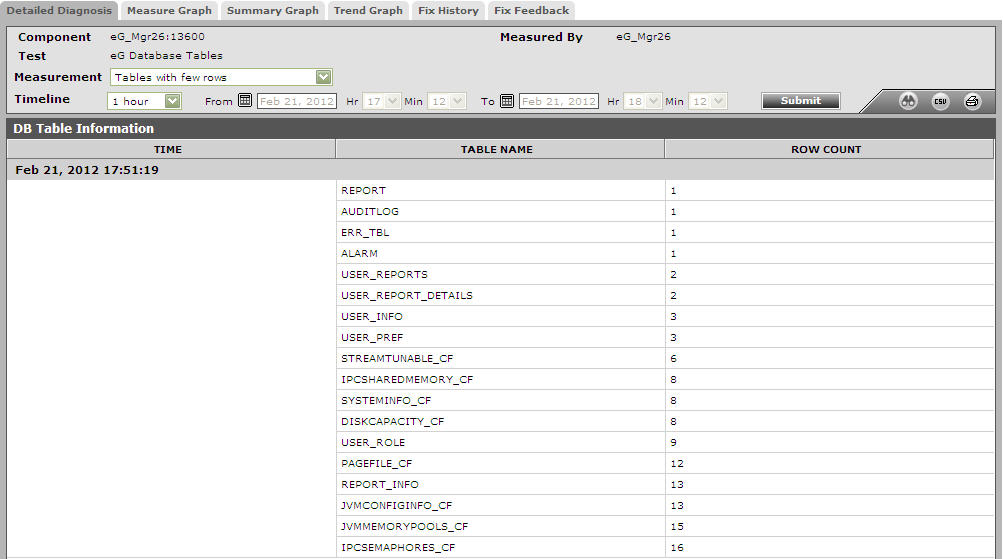
Figure 4 : The detailed diagnosis of the Tables with few rows measure
The detailed diagnosis of the Tables without primary key measure displays all the tables that do not have any primary key.
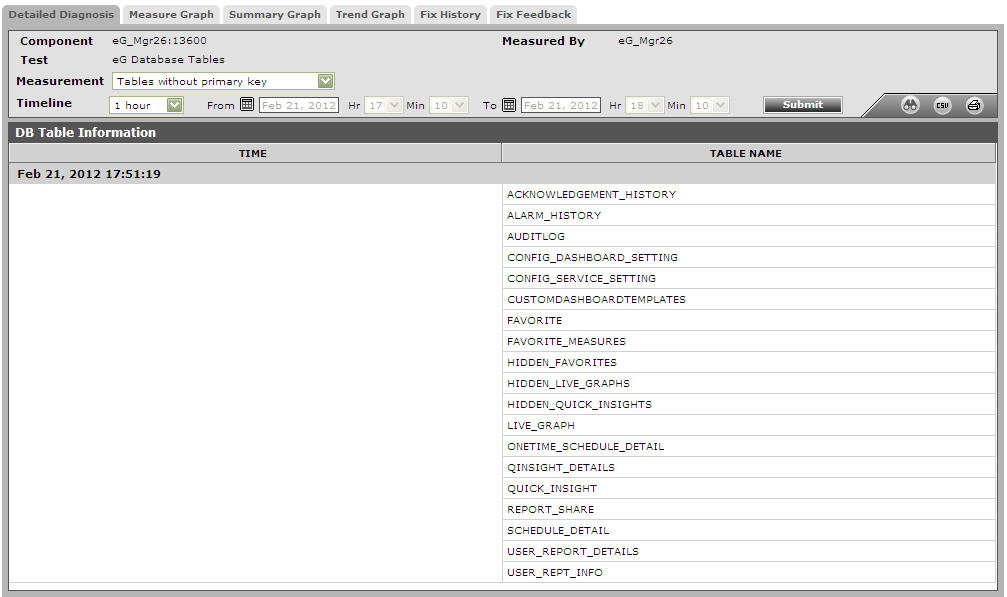
Figure 5 : The detailed diagnosis of the Tables without primary key measure
The detailed diagnosis of the Tables without index measure displays all the tables that do not have any index.
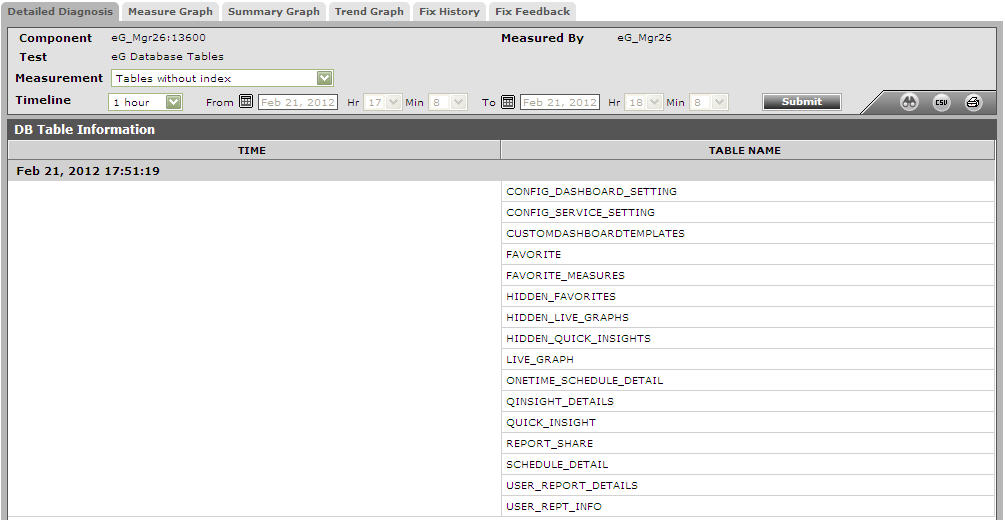
Figure 6 : The detailed diagnosis of the Tables without index measure