IIS monitoring to ensure great web application performance

Get full visibility into all aspects of IIS web server performance. Monitor all web sites, user accesses, get alerts on slowness, errors and traffic surges. Proactively detect and fix issues fast, before users notice.

Free Trial

Trusted by leading companies

Why is monitoring of IIS web server important?

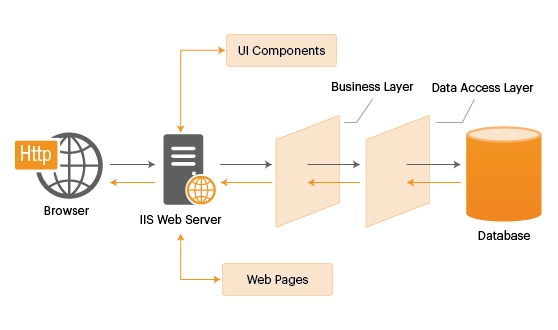
Microsoft's Internet Information Server (IIS) plays a pivotal role in supporting web applications on Microsoft Windows operating systems. Using a thread-per-request processing model, Microsoft IIS offers a scalable way of supporting web sites and applications. While IIS is widely used to host ASP.NET web sites and applications, it can also be the front-end for other applications based on Java, PHP, etc.

Microsoft IIS logo

In a multi-tier architecture the front-end IIS web server handles all the information relating to user activity, accesses, errors, and security events and so any slowdown in the web server tier will adversely affect the entire application's performance and ultimately, the user experience.

eG Enterprise is the ideal real-time monitoring, diagnosis, and reporting tool for heterogeneous web server farms. Using a combination of active and passive monitoring eG Enterprise tracks the availability and performance of the web applications and pinpoints where performance bottlenecks lie in the web server, middleware, database, virtualization platform, storage, etc.

Key challenges in monitoring IIS web servers

  • A single IIS web server can host multiple websites. When there are excessive requests to one website, this can affect the performance of other websites.
  • Application pools form an important part of an IIS server system. An individual application pool could have many IIS worker processes associated with it. Websites are mapped to different application pools and share the pool's resources. As resource sharing happens across websites, a memory leak or a runaway thread during processing of one website can affect other websites as well. Identifying which website is the cause of a problem can be a challenge.
  • As web applications involve multiple processing tiers, a slowdown in any backend tier will often manifest in a bottleneck at the web tier. Hence, identifying when does a problem occur where is the root-cause is often challenging: is it the web server, or the database, or the business logic, or the supporting infrastructure?
  • Performance issues may also be in the application code. Visibility into the malfunctioning portions of the application code is critical for development and DevOps teams to detect and resolve issues quickly.

eG Enterprise for IIS monitoring

With eG Enterprise's full stack monitoring capabilities, keep your IIS-based web applications working well.

  • Monitor responses from all IIS web sites, for all transactions; identify web sites and transactions that are slow
  • Monitor all IIS components – worker processes, application pools, web sites, requests, etc.
  • Track all application pools and identify resource hogs
  • Monitor the .NET CLR and application code. Get code-level visibility to identify hotspots easily
See Demo

With eG Enterprise, we can now quickly identify root causes of incidents, resolving them before users are impacted. Automatic prioritization and categorization of alerts helps us better focus on the important issues and prioritize our resources accordingly.

Andrew GowlettSenior Consultant, C5 Alliance

The complete microsoft IIS web server
performance monitoring solution

Monitor digital user experience

  • Use a combination of request/response protocol simulation and multi-step web application simulation to synthetically measure the performance of any application. Track key transactions 24x7 and get proactive alerts, if any slowness occurs.
  • Inject JavaScript code transparent to your web application and monitor real-user accesses to your application. Identify the slowest web page accesses, track if any JavaScript errors are occurring, and determine whether specific web pages are very slow because they have a lot of internal links.
  • Detect whether performance degradations are specific to geographies, or to specific browser versions. Get a 360° view of the performance of your web applications.
RUM Dashboard

Monitor IIS access logs and detect errors

  • Monitor IIS web server logs passively. Track the workload to each website hosted on the web server. Identify whether there are errors occurring, report the URLs affected along with the website they correspond to.
  • Track inbound and outbound traffic for each website and overall response time for each website. Get access to details of the top few slowest accesses by response time.
  • Get details of responses in error: accesses denied, logon failures, server configuration issues, forbidden content, not found errors, internal server errors, requests timed out, module or ISAPI errors, web server busy errors, internal ASP errors, etc.

Monitor microsoft IIS processing bottlenecks

  • Monitor IIS worker process and their resource utilization levels.
  • Detect any unusual errors or warnings in Windows event logs.
  • Monitor the .NET CLR and report any garbage collection issues.
  • Track threads spawned in the .NET CLR and their contention rate and queue levels.
  • Report application and worker restarts that happen.
  • Monitor ASP.NET application sessions and connections to SQL database backends.
  • Report the performance of each application pool. Report pool recycles, startup failures, ping failures, etc. Report on requests that are in process in each application pool.
  • Report requests processed per website and slow requests. Provide details of requests that are taking a long time to be processed so that performance bottlenecks can be identified.

Identify .NET code-level bottlenecks

  • Profile your web applications, which are based on .NET technology.
  • Auto-detect transactions being accessed by users.
  • For each transaction report request rate, get an average of the processing time and identify slow and stalled transactions.
  • Report transactions with errors and provide diagnosis showing the exception raised and which line of code caused this.
  • For slow or stalled transactions, by using tag-and-follow tracing, identify which tier caused the processing bottleneck. Pinpoint the line of .NET code that is causing slowness, or the SQL query that is taking more time
Pagerduty alerting screen

What eG Enterprise monitoring for microsoft IIS reveals

External monitoring
  • Is the website available for user accesses from different locations?
  • What is the user experience (i.e., response time for user accesses) to the site from different geographic locations?
  • Is a slowdown due to increased network latency or due to increased server-side processing?
Internal web transaction monitoring
  • How are the critical transactions of the website functioning?
  • What is the request rate for each web transaction?
  • What is the average response time for each web transaction?
  • Are there many aborts for a web transaction?
IIS Web site monitoring
  • What is the status of the different websites hosted on an IIS web server?
  • Are there many errors (404, 500, etc.) detected on the web server?
  • Are the servers supporting the web infrastructure adequately sized?
  • Are there any usage trends that need to be accounted for future capacity planning?
Bottleneck detection
  • Is an increase in server-side processing time due to the web server or due to the middleware application server or due to the database?
Capacity planning
  • Is the load being effectively balanced across all the IIS web servers?
  • Do the IIS web servers have sufficient CPU, memory, network. or disk resources?


Start your free trial or schedule a custom demo with an engineer

  • Works on cloud environments, hybrid cloud setups and on-premises deployments
  • Deploy eG Enterprise using our SaaS platform or on-premises
  • Suitable for monitoring applications, digital workspaces and IT infrastructures
Please Enter Valid Work Email
eG Enterprise