Monitor your entire JBoss infrastructure within a single-pane-of-glass and get visibility into the performance of your JVM, web and EJB containers, application code, database connections, slow queries, external service calls, and more.
Free TrialTrusted by leading companies

The JBoss application server is widely used for building, deploying, and hosting highly-transactional Java applications and services. To ensure high application performance, it is essential to monitor the JBoss application server, the components it hosts and the infrastructure tiers supporting it. IT teams and developers need this capability in order to proactively detect performance problems before they impact end-users of the Java application.
Common challenges faced by administrators:


eG Enterprise provides a single-pane-of-glass view of the entire JBoss infrastructure. From an intuitive web console, application owners, developers and administrators can monitor the full Java stack including the JVM, web and EJB containers, application code, database connections, slow queries, external service calls, and more.

eG Enterprise helps you enhance the performance of your JBoss applications:
eG Innovations delivers a robust, reliable and extremely valuable solution to deliver maximum uptime and user satisfaction. Pre-emptive alerting helps us to address performance issues immediately before they affect system and application availability.![]()


Automatic correlation with server-side issues, resource deficiency (CPU, memory, disk, etc.), and hardware faults differentiates application issues from the infrastructure.
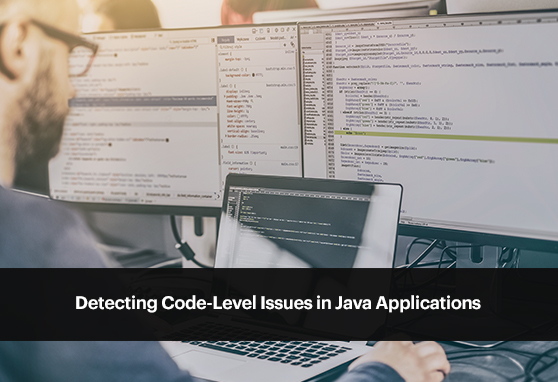
eG Enterprise allows developers to easily identify Java code-level issues.


eG Enterprise delivers total performance assurance for web applications powered by Java technology:

Red Hat JBoss Enterprise Application Platform (JBoss EAP) is an open-source Java-based application server platform that offers a robust platform for managing various types of Java applications ranging from microservices to traditional Java applications.
JBoss’s modular architecture is specifically designed to deliver optimal performance for applications across private, public, or hybrid clouds. With its exceptionally low memory footprint and swift startup times, JBoss EAP is particularly well-suited for environments where efficient resource allocation is crucial, such as Red Hat OpenShift.
Developers get support for Jakarta EE web-based frameworks as well as other industry leading technologies such as Spring, Spring Web Flow, Angular, React and jQuery. You also get support for traditional enterprise Java technologies such as Java Servlets, JavaServer Pages (JSP), and Enterprise JavaBeans (EJB), ensuring the seamless deployment of Java applications across diverse environments.
JBoss EAP has the following features and advantages that make it a great platform to deliver high-performance enterprise Java applications:
The key components of the JBoss architecture include:
JBoss EAP (Enterprise Application Platform) and WildFly are two variants of the JBoss application server, each with distinct characteristics and target audiences.
JBoss EAP:
WildFly:
Your decision will have to consider various factors such as support needs, enterprise requirements, and the preference for commercial support versus community-driven development. If you are looking for enterprise-level requirements, JBoss EAP is a good choice. On the other hand, if you value community-driven open-source innovation and flexibility, Wildfly is a good bet.
JBoss EAP provides a supported and enterprise-ready version of Tomcat, along with additional features and capabilities that make it unique for enterprise needs.
JBoss is a certified Java EE compliant application server and therefore provides extensive support for various enterprise Java APIs. It supports not only the Servlet and Java Server Page (JSP) specifications but also other enterprise APIs such as JAX-RS web services, Contexts and Dependency Injection (CDI), Java Message Service, JavaMail, and Java Naming and Directory Interface. It also offers support for enterprise development APIs like CDI, Java Transaction API, JavaServer Faces (JSF), Hibernate, and JPA.
On the other hand, Tomcat is primarily a Servlet engine. It focuses on providing an implementation of the Servlet and JSP specifications. It also supports a few complementary APIs like WebSockets, the Java Authentication Service Provider Interface for Containers, and the expression language API. However, out of the box, Tomcat does not have inherent support for many enterprise development APIs like CDI, JSF, Hibernate, and JPA.
JBoss would be a better choice if you need comprehensive support for a wide range of Java APIs and enterprise development features out-of-the-box. However, if you prefer the lightweight nature of Tomcat but still need additional APIs, you can consider using a product such as TomEE or integrating external projects (such as Spring framework) to add the required functionality.
As an SRE or JBoss administrator, you should take a holistic approach to tuning JBoss performance. Performance tuning should encompass multiple layers, including the operating system, JVM, JBoss container, and application code. Focusing solely on tuning the JBoss application server is not enough, as it relies on the underlying JVM and operating system. Neglecting these layers can hinder performance and lead to complaints about JBoss being slow.
To ensure high performance, it is crucial to consider each layer in the performance tuning process. Starting with the operating system, optimizing its configuration plays a vital role in maximizing performance. Similarly, tuning the JVM is critical since JBoss runs on top of it. A well-configured JVM can greatly enhance overall performance. Additionally, configuring the JBoss container is essential for fine-tuning its behavior and resource allocation.
However, performance issues can also stem from bottlenecks within the application code itself. Identifying and resolving these bottlenecks is an important aspect of JBoss performance tuning. By analyzing the code and optimizing its execution, you can eliminate potential performance constraints.
Monitoring Red Hat JBoss should be done at various levels, including:
By monitoring at these levels, you can quickly diagnose and resolve performance issues in your JBoss applications.