eG Enterprise monitors all aspects of JVM performance and unearths server-side bottlenecks that impact the operation of your Java applications. Identify run-away threads, memory leaks, deadlocks, Garbage Collection issues and more.
Free TrialTrusted by leading companies

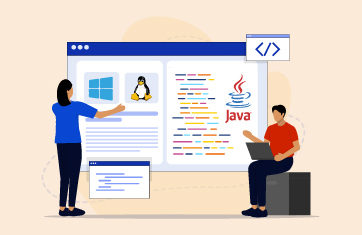
The Java Virtual Machine (JVM) is the core of the Java application architecture. It interprets and translates the Java byte code into operations on the host platform. Because the Java middleware - including application servers such as Tomcat, JBoss EAP, WildFly, GlassFish, WebSphere, WebLogic - runs on the JVM, a performance issue in the JVM has a significant impact on business services it supports.
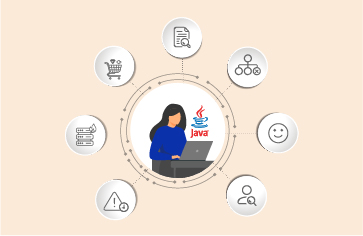
Monitoring of the JVM is an integral part of any Java application performance monitoring strategy. IT Ops and DevOps teams use JVM performance metrics to troubleshoot server-side bottlenecks. Developers and architects can also benefit from JVM monitoring by uncovering code-level issues.


eG Enterprise is a state-of-the-art Java application monitoring solution that goes deep into analyzing issues across all Java tiers—from user experience, web front-end, application server, JVM, all the way to backend database and storage. Using JMX, eG Enterprise monitors JVMs in depth, tracking key performance indicators of all aspects of a JVM’s performance.
Unlike other JVM monitoring tools, from a single, easy-to-use web console, administrators and developers can analyze JVM performance, correlate it with other infrastructure metrics (server, virtualization, storage, etc.), and see actionable insights in the form of proactive alerts and intuitive dashboards for rapid problem diagnosis.
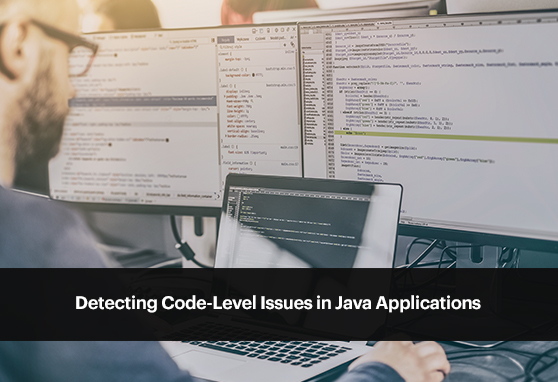
eG Enterprise analyzes hundreds of JVM performance metrics and identifies code-level bottlenecks including thread synchronization issues, deadlocks, memory leaks, GC issues and application configuration issues such as insufficient heap memory.
Since we don't control everything between our data center and client locations, events occasionally occur where service availability or application performance issues arise. eG Enterprise helps us pinpoint the nature and origin of the problem right away so we can resume normal operations as quickly as possible.![]()

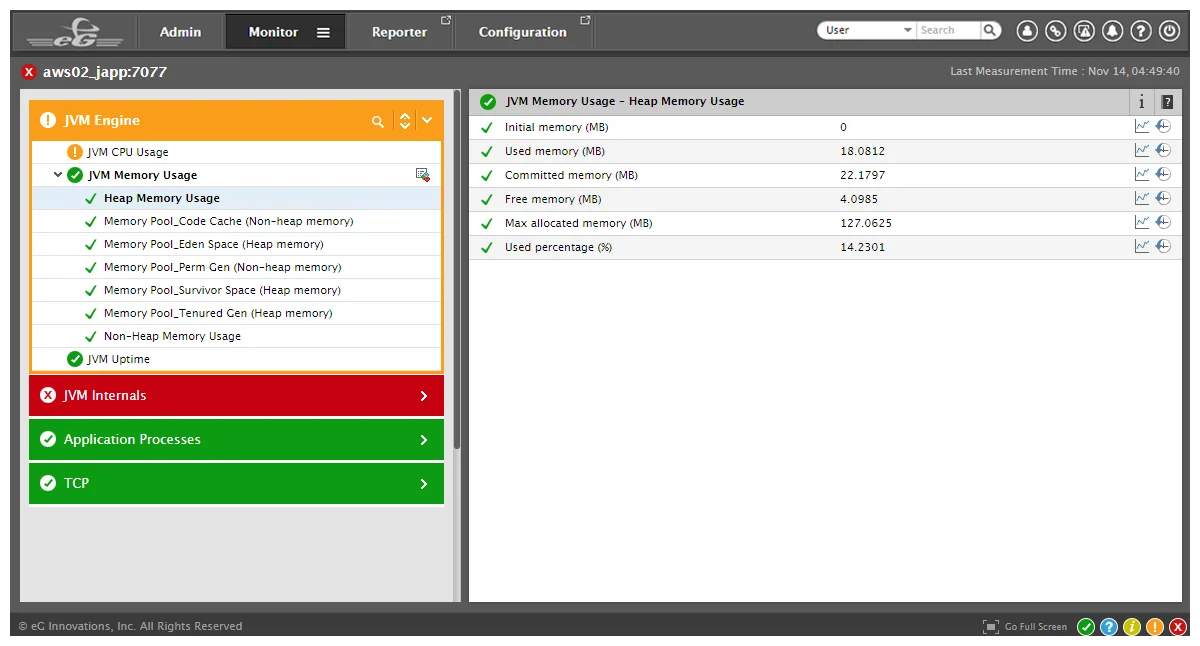
Java applications can fail or slow down if the memory available in the JVM is insufficient to handle the workload. eG Enterprise tracks usage levels of the JVM’s heap and non-heap memory and proactively alerts if memory usage levels are high.
Analysis of each of the memory pools including Eden space, Survivor space, Tenured gen and Perm gen space highlights how the JVM’s memory pool settings can be right-sized for improved performance. Memory monitoring at the JVM level also highlights any out-of-memory exceptions and potential memory leaks. In the latter case, top object types consuming memory are highlighted, making it easier for Java developers to fix memory leaks.

Most production Java applications are multi-threaded. eG Enterprise tracks all the thread activity in the JVM. With thread-level metrics, Java application administrators and developers can:


eG Enterprise allows you to easily track all garbage collection activity in the JVM: Identify when garbage collection happened, how often it is happening, how much memory is being collected each time and how long the garbage collection activity is running for.

Although the JVM performs automatic memory management, it cannot counter for memory leaks in your Java applications. Memory leaks are difficult to identify because they can take several days or weeks to manifest. Identifying the cause of Java memory leaks can be challenging, especially in production. eG Enterprise periodically takes and analyzes memory dumps of the JVM and identifies the top consumers of Java heap memory. Based on the automatic analysis of Java memory usage by eG Enterprise, administrators can be alerted to potential memory leaks in the application and can easily identify the exact Java class that may be resulting in a memory leak.


Java is the primary programming language used for modern applications. See our APM survey which has detailed statistics about the popularity of different application technologies.
Java technology can be used for server applications and client applications. While Java performance monitoring focuses on server applications mainly, some of the performance monitoring concepts are also applicable for client applications also.
The JVM is the heart of any Java application. The JVM is the runtime engine of the Java Platform which allows any program written in Java to run on any computer that has a native JVM.
JVM is at the heart of any Java application. Monitoring of the JVM provides insights into how the JVM is functioning – its CPU usage, memory usage, activities of functions like Garbage Collection, etc. Monitoring of the JVM can provide proactive alerts that can help an application operations team/DevOps team understand if there are bottlenecks in the JVM that are affecting application performance.
There are hundreds of JVM metrics that you can be monitoring. The more metrics you monitor, the more visibility you get into the performance of your Java application. Some of the key JVM metrics to monitor include usage of the heap and non-heap memory vs. the maximum limits set, CPU usage, garbage collection activity, and thread activities (deadlocks, blocked threads, etc.).
Yes, monitoring of the JVM can highlight issues in the application code. E.g., if a JVM is taking a lot of CPU, you can determine which thread and which line of code in which class (including the full stack trace) is being executed when the CPU usage is high. Likewise, analysis of JVM heap dumps can highlight which class or object has a memory leak, which could be because of a bug in the application code.
Yes, the configuration parameters used when a JVM is started can affect its performance. For example, the maximum size of the JVM heap is specified at JVM start-up. If this value is too small for the application workload, this will lead to excessive garbage collection, which in turn will slow down the Java application. JVM monitoring tools can highlight such issues by reporting the percentage of JVM heap being used.
JVM metrics can be obtained in different ways. There are several free tools available including JConsole, JVisualVM, etc. that provide insights into JVM performance. If you want continuous and proactive monitoring of the JVM, you will need to deploy a comprehensive monitoring solution that includes AIOps capabilities, will alert on anomalous behavior, will store historical metrics in a database and perform trend analysis and so on. eG Enterprise is one of the popular JVM monitoring tools in the market.
There are dozens of JVM monitoring tools available and the best tool depends on your requirements. A free JVM monitoring tool might give you an instant snapshot of the resource usage of your JVM, but it might not be able to constantly monitor and send alerts if thresholds are breached. A more comprehensive Java application monitoring tool like eG Enterprise can monitor your entire Java application stack (JVM, application server and application code) as well as the underlying IT infrastructure to help you quickly pin-point the root-cause of an application slowdown.
No. Monitoring of the JVM is not sufficient. Most applications are run on Java application servers like Tomcat, JBoss, WebLogic, WebSphere, etc. Performance bottlenecks in these application servers can affect application performance. For instance, the maximum number of threads to be used by the application server is a configuration setting. If this value is too low, this will cause performance bottlenecks. Check out these blogs to see how to tune JBoss, Tomcat and WebLogic application servers for maximum performance.
Thread level monitoring at the JVM level can provide some indicator of application code issues. Monitoring of the Java application server may also provide metrics about application components – e.g., which servlet is taking more time to respond. To get deeper insights into application logic, Java transaction tracing is necessary. This is usually done using byte-code instrumentation. To learn more about Java application transaction tracing, see here.
Yes, both JVM monitoring and Java transaction monitoring can provide code-level insights. You can see which thread is a problem, which line of code it is running. With transaction tracing, you can see if a specific database query is taking more time or if an external service call (e.g., a request to an external payment gateway) is taking more time.
Yes, JVMs do expose SNMP interfaces for external monitoring tools. However, the depth and breadth of metrics collected is very limited. For example, it is not possible to see an entire stack trace with SNMP. Hence, SNMP is not recommended for Java performance monitoring.