


In this guide we’re going to look at JBoss performance tuning tips and techniques across four different areas. However, it should be noted that simply doing performance tuning on JBoss alone is not enough to produce a high performance application. It is just one of the steps that you need to follow. We’ll get into more details about how to do total performance tuning for Java applications later on in this guide.

What is JBoss?
JBoss is an open source, standards-compliant, J2EE application server implemented in 100% pure Java. There are many variants of JBoss available today:
- JBoss EAP is the name for the Java EE application server that Red Hat produces and supports.
- JBoss AS and WildFly are the community versions of the JBoss application server.
While Apache Tomcat used to be the underlying engine for JBoss EAP and AS, more recently, Undertow is used as the application server engine.
For long, JBoss has been one of the most popular and free application servers available. As a result, it has found applicability across several verticals and use cases. When deployed in production, it is essential that the JBoss application server performs well. This requires that JBoss be configured to handle the maximum load possible and yet provide the best response time to users. The performance that an application server delivers is often dependent on how well it is configured. Often, the default settings provided are non-optimal. This blog post documents best practices that you should employ when deploying JBoss in production.
A Holistic Approach is Needed for Tuning JBoss Performance

the operating system, JVM, JBoss container,
and at the application code-level
A first step to achieving high performance is to recognize that tuning the JBoss application server alone is not sufficient. After all, JBoss runs on top of a Java virtual machine (JVM). So, a poorly configured JVM will compromise performance. Likewise, the JVM runs on an operating system and it is important to have the best possible operating system configuration to achieve the highest performance possible. Even bottlenecks in the application code can result in “JBoss is slow” complaints.
All in all, a holistic approach must be taken for JBoss performance tuning.
In the following sections, we will present best practices to tune the JBoss application server. This will involve:
Configuring the Operating System for High Performance

- Ensure that the server operating system is sized correctly for the expected workload. Monitor the utilization of server CPU and memory to ensure that there are no CPU and memory bottlenecks. To achieve best performance, use a 64-bit operating system.
- For best performance, ensure that a dedicated system is provided for JBoss. If the system being used is a virtual machine, ensure that VM Ready time is low (well below 5%), which means that the VM is getting CPU when it needs it. In a cloud environment, make sure that the server’s resource usage is not hitting any resource configuration limit (e.g., DTU usage is not close to 100% in Microsoft Azure).
- There are also several well documented operating system tweaks that should be applied to get the maximum performance:
- On all JBoss or WildFly servers, set the Open Files (ulimit –n) to at least 50,000 for the user that runs the JBoss or WildFly process.
- On all JBoss or WildFly servers, set the User Process (ulimit –u) to at least 131,072 for the user that runs the JBoss or WildFly process.
- Set the connection backlog accordingly. Change the value of the echo parameter to 3,000 when a high rate of incoming connection requests result in connection failures:
echo 3000 > /proc/sys/net/core/netdev_max_backlog
echo 3000 > /proc/sys/net/core/somaxconn
- Set the value of the TCP_KEEPALIVE_INTERVAL parameter to 15 seconds, which is the recommended value. The default value is 75 seconds.
echo 15 > /proc/sys/net/ipv4/tcp_keepalive_intvl
- The TCP_KEEPALIVE_PROBES parameter determines the number of probes before timing out. Set the value of the TCP_KEEPALIVE_PROBES parameter to 5 seconds, which is the recommended value. The default value is 9 seconds.
echo 5 > /proc/sys/net/ipv4/tcp_keepalive_probes
If the JBoss server is deployed on a Microsoft Windows server, changes to Windows registry settings may be required. See this article for a list of registry changes recommended.
Tuning JBoss’ JVM
As JBoss uses a JVM, the performance of the JVM impacts JBoss’ performance as well:
- Before you start adjusting any settings, you should make sure that you have chosen a modern JVM for your application. There are many benchmarks that indicate 5-20% performance gains from each version of Java (refer to this article for more details).
- Many JVMs are available in 32-bit and 64-bit modes. While the 32-bit mode is limited to 2GB of memory, 64-bit JVMs allow for the Java heap to be set much higher. Hence, make sure you are using a 64-bit JVM for best performance and highest scalability.
Garbage collection is the process by which Java programs perform automatic memory management. In the past, garbage collection was done in a stop-the-world manner. That is, when garbage collection happened, the application was paused to reclaim memory. Today, there are many garbage collection implementations where the garbage collection happens in parallel with the application execution:
- For best performance, make sure that you choose a modern garbage collector like G1GC
(Garbage First Garbage Collector) or the Z Garbage Collector. - The MaxGCPauseMillis setting for the JVM can be used to set the peak pause time expected in the environment. It is recommended that this value be between 500-2000ms for best performance. While longer pauses increase throughput, shorter pauses reduce the latency and the throughput. In addition to the different GC settings, monitor the JBoss server in production and make sure that the percentage of time that the JVM spends on garbage collection is low. Any value over 5% will be detrimental to JBoss’ performance.
Memory availability in the JVM can also adversely impact JBoss performance:
- You must make sure that sufficient memory is available in all the heap and non-heap memory pools. If any of the memory pools is running out of available memory, you will encounter OutOfMemory exceptions and the application can fail in unexpected ways. Use the Xmx and Xms flags of the JVM to set the maximum heap size and stack size, and the XX flags to set the PermSize or MetaspaceSize depending on the version of the JRE being used (read this article for additional details).
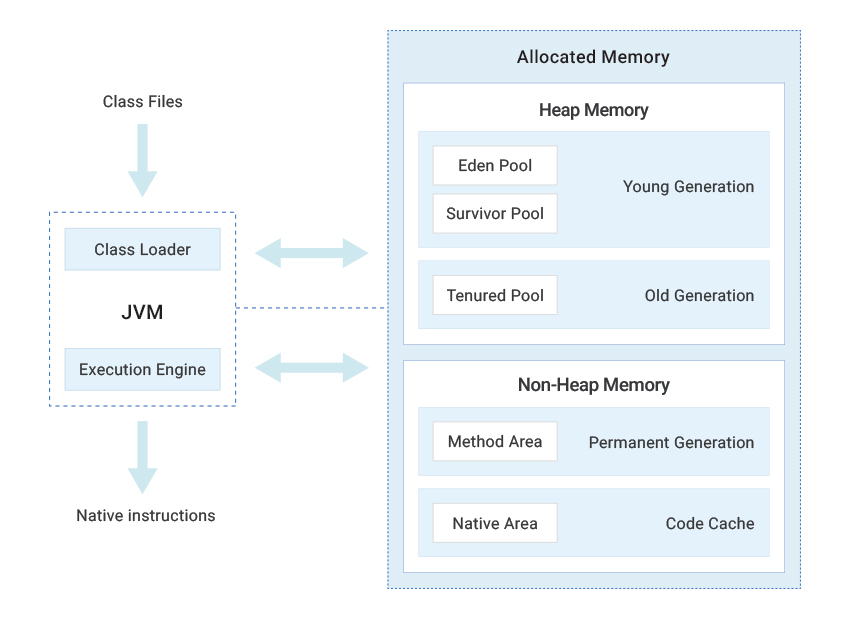
pools of the JVM is sufficient. Memory shortage will
adversely affect JBoss server performance.
- Setting the memory limits is often a trial-and-error process. Setting the memory limits to be too low can result in exceptions while setting them too high can result in waste of resources. Use a JVM monitoring tool and analyze performance during a week or more, considering peak hours as well to determine optimal values of the JVM memory pools.
If memory grows unbounded in the JVM, you will need to determine if there is a memory leak in the application:
- Take a memory heap dump by using Java built-in tools, such as JvisualVM and Jconsole. Use tools such as the Eclipse Memory Analyzer (MAT) to determine memory leak suspects. The Dominator Tree of MAT will help you narrow down which threads/objects are causing the memory leak.
Finally, track thread activity in the JVM:
- Whereas total threads in the JVM must be tracked to discover any thread leaks, it is important to track thread blocks and deadlocks as they are detrimental to performance. Stack trace of blocking threads and deadlocked threads can reveal application code-level issues.
- In addition, monitor the CPU usage of individual threads to detect run-away threads that are taking CPU and slowing down JBoss. Again, any JVM-level monitoring tool can provide these insights.
- In some cases, background threads of an application may be taking excessive resources. By monitoring thread activity, you can determine such scenarios and even determine the line of code/method that is causing the problem.

Tuning the JBoss Container
 As is the case with the JVM, many scalability and security enhancements have been made with the latest releases. Hence, make sure that you are using the latest version of JBoss/Wildfly.
There are several configuration parameters that must be tweaked to scale a JBoss server instance. The exact configuration depends on the version of JBoss and whether the underlying servlet container is based on Tomcat or Undertow.

- Web Front-end Tuning
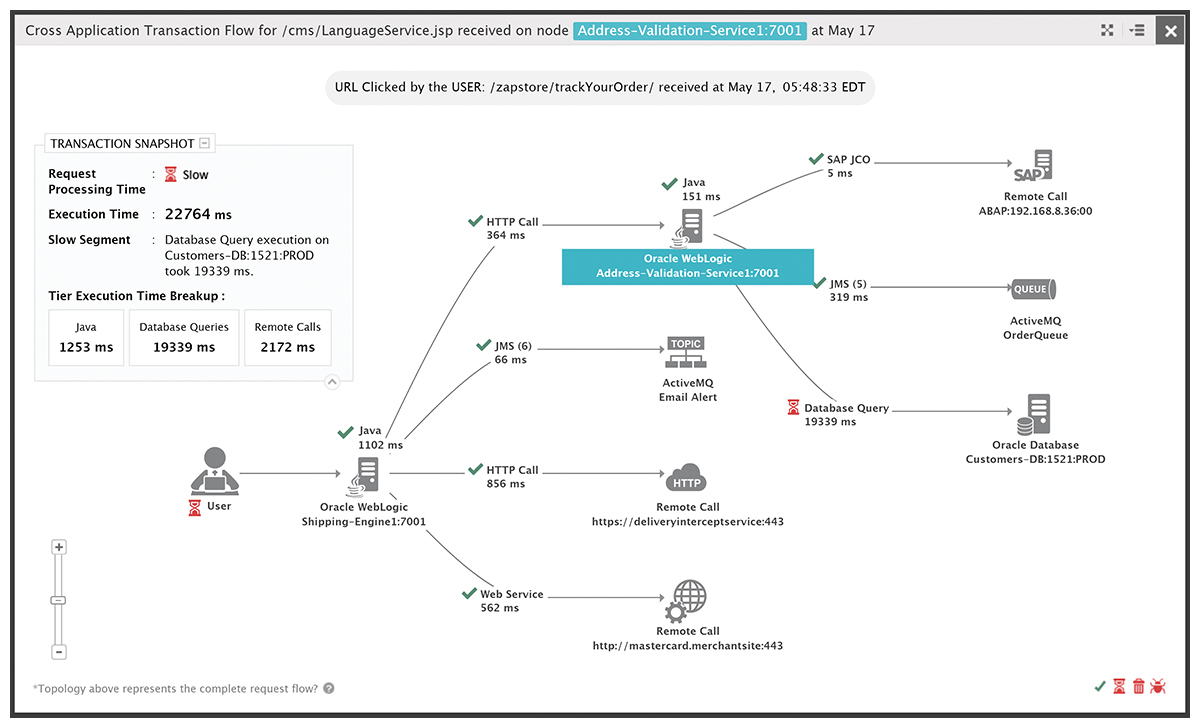
To tune the performance of a Java application server, it is important to understand the different steps involved in processing a request. The figure above shows a request from a Web front-end reaching WildFly EJBs, which in turn issues queries to a backend database server.In the JBoss/Wildfly application server, the web request is handled by an Undertow XNIO thread. Setting a sufficient number of IO threads in the Undertow web container is extremely important, otherwise you will have a bottleneck in the first stage itself.Provided that there are enough io-threads to serve your http request, the task-core-threads (first) and the task-max-threads (after) are used to determine if the request is served or if it is discarded. Hence, it is important to configure the io-threads, task-core-threads and task-max-threads accordingly in the XNIO pool configuration. These settings are configured through the Undertow IO subsystem:/subsystem=io/worker=default/:write-attribute(name=task-core-threads,value=50) /subsystem=io/worker=default/:write-attribute(name=task-max-threads,value=100) /subsystem=io/worker=default/:write-attribute(name=io-threads,value=100)
You also need to consider the number of sessions, which are running. The parameter max-active-sessions is used to determine how many active HTTP sessions are allowed. When the number of active sessions exceeds the max-active-sessions setting, the oldest session known to the session manager will passivate to make room for the new session. To avoid this, set the max-active-sessions number accordingly in the jboss-web.xml file:
<jboss-web>
 <max-active-sessions>200</max-active-sessions>
</jboss-web>
Continuous monitoring is necessary to ensure that there are no bottlenecks in web request handling – either due to insufficient worker threads or due to a low max sessions limit.
- EJB Container Tuning: After an IO thread finishes processing a request, an EJB is picked up from the Pool(Stateless EJB) or pinned from the Cache (Stateful EJB). If you are using Stateless Session Beans, be aware that EJB pooling is not enabled by default on WildFly 8. A poorly configured pool of EJBs could be even detrimental in terms of performance, and hence, setting the correct configuration for the EJB cache is important.
- Tuning Database Connection Pooling: In case you are dealing with Database connections, you must acquire a connection from the pool, that is governed by the JCA layer. The key configuration parameter is max-pool-size, which specifies the maximum number of connections for a pool (default 20). Note that there will be a maximum limit for the number of connections allowed by the database to match. You can set your Connection pool max size to a different attribute using this CLI:
/subsystem=datasources/data-source=MySQLDS/:write-attribute(name=max-pool-size,value=50)
Monitoring of connection pool usage is important to ensure that there are sufficient connections available in the pool to handle the workload being handled by the Wildfly server.
- Tuning Database Connection Pooling: In case you are dealing with Database connections, you must acquire a connection from the pool, that is governed by the JCA layer. The key configuration parameter is max-pool-size, which specifies the maximum number of connections for a pool (default 20). Note that there will be a maximum limit for the number of connections allowed by the database to match. You can set your Connection pool max size to a different attribute using this CLI:
-
- Other optimizations: There are several other optimizations that can be performed depending on whether Tomcat or Undertow is the servlet engine used. We have discussed several optimizations for Tomcat in an earlier blog. For Undertow:
- Consider tuning the buffer cache. A buffer cache is used to cache static files handled by the undertow This includes images, static HTML, CSS, and JavaScript files. Having an optimized buffer cache for your servlet container can improve Undertow performance for serving static files.
- JSP Compilation optimizations: There are JSP configuration options for Undertow servlet containers that provide optimizations for how JSP pages are compiled into Java bytecode:
- generate-strings-as-char-arrays: If your JSPs contain a lot of Stringconstants, enabling this option optimizes scriplets by converting the String constants to char
- optimize-scriptlets: If your JSPs contain many Stringconcatenations, enabling this option optimizes scriplets by removing String concatenation for every JSP request.
- trim-spaces: If your JSPs contain a lot of white space, enabling this option trims the white space from HTTP requests and reduces HTTP request payload.
- Tuning Listeners: Depending on your applications and environment, you can configure multiple listeners specific to certain types of traffic.Some performance-related options for listeners include:max-connectionsThis is the maximum number of concurrent connections that the listener can handle. By default, this attribute is undefined, which results in unlimited connections.You can use this option to set a ceiling on the number of connections a listener can handle, which might be useful to cap resource usage. While configuring this value, you should consider your workload and traffic type.no-request-timeoutThis is the length of time in milliseconds that a connection is idle before it is closed. The default value is 60000 milliseconds (1 minute).
Tuning this option in your environment for optimal connection efficiency can help improve network performance. If idle connections are prematurely closed, there are overheads in re-establishing connections. If idle connections are open for too long, they unnecessarily use resources.
max-header-size
This is the maximum size of a HTTP request header in bytes. The default is 1048576 (1024KB).
Limiting the header size can be useful to prevent certain types of denial-of-service attacks.
- Other optimizations: There are several other optimizations that can be performed depending on whether Tomcat or Undertow is the servlet engine used. We have discussed several optimizations for Tomcat in an earlier blog. For Undertow:

Tuning the Application Code Performance
Inefficient application code can also cause the application deployed on JBoss/Wildfly to be slow. Logging is a common way to track an application’s operation. However, logging to output files is a synchronized operation and excessive logging can actually slow down application performance.
Employ transaction tracing techniques that are based on byte-code instrumentation to monitor application processing without needing any changes to the application code. These techniques rely on a specially crafted jar file that utilizes the instrumentation API that the JVM provides to alter existing byte-code that is loaded in a JVM.
IT teams and developers can use this capability to drill down into slow transactions and proactively detect performance problems before they impact end-users.
eG Enterprise is an Observability solution for Modern IT. Monitor digital workspaces,
web applications, SaaS services, cloud and containers from a single pane of glass.
Conclusion
You may often hear that application servers based on Java, such as JBoss, are slow or not production ready. In this blog, we have provided a range of best practice configurations to help you get the most out of your JBoss web application server.
eG Enterprise is an Observability solution for Modern IT. Monitor digital workspaces,
web applications, SaaS services, cloud and containers from a single pane of glass.
 Arun is Head of Products, Container & Cloud Performance Monitoring at eG Innovations. Over a 20+ year career, Arun has worked in roles including development, architecture and ops across multiple verticals such as banking, e-commerce and telco. An early adopter of APM products since the mid 2000s, his focus has predominantly been on performance tuning and monitoring of large-scale distributed applications.
