Proactive Performance Monitoring of .NET Applications
When users report slow performance from a Microsoft .NET application, substantial time and effort is often required to determine where the issue is and how to fix it. Any slowness in the .NET application affects the end-user experience and, subsequently, the business productivity. Every second of application slowdown counts.
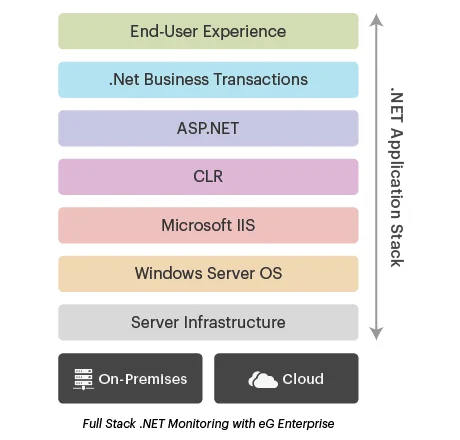
eG Enterprise is a full stack application performance monitoring (APM) solution that delivers deep visibility into the performance of .NET applications – from code to SQL statements, CLR to IIS, and the supporting infrastructure (Active Directory, network, virtualization, storage, databases and cloud).
- Measure the digital experience of users in real time
- Analyze critical business transactions and diagnose slowdowns
- Get .NET method-level visibility to fix application code issues
- Understand application dependencies with underlying infrastructure
- Auto-correlate alerts & isolate the root cause of performance problems
Full Stack Microsoft .NET Application Performance Monitoring
-
Optimize Digital User Experience for .NET Web Apps
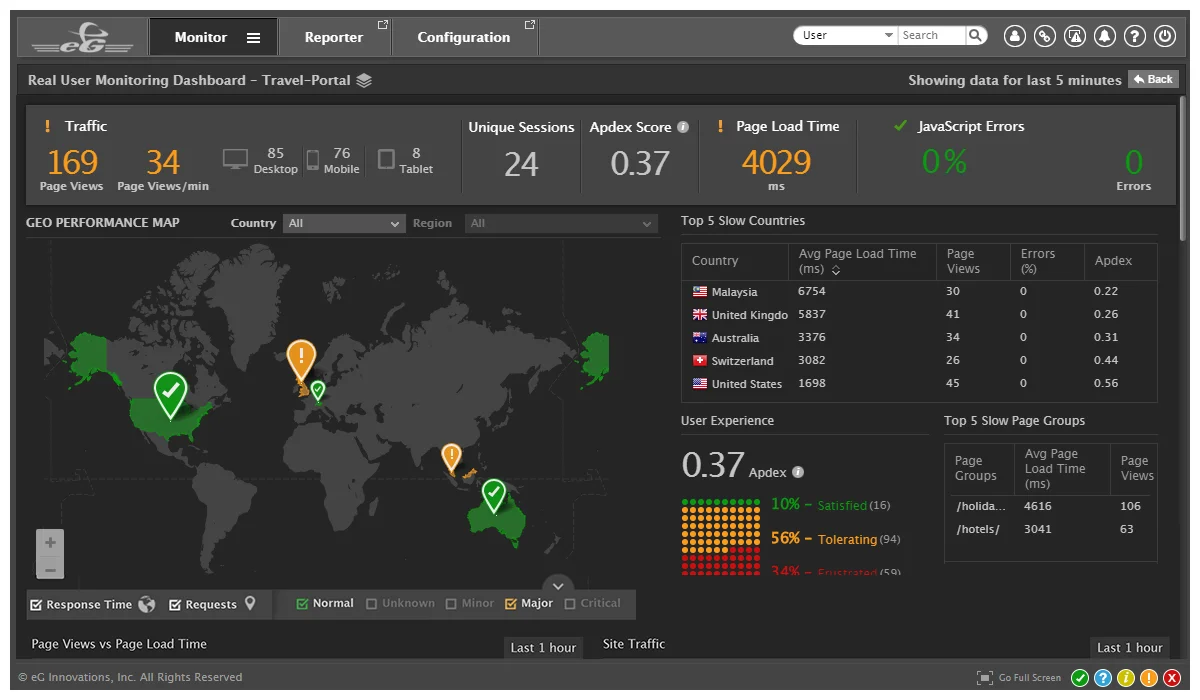
Use built-in real user monitoring (RUM) capabilities to measure the customer journey in real time. Know when and where user experience problems occur.
- Monitor browser access to .NET applications and receive proactive alerts for slowdowns, errors, and downtime
- Measure industry-standard Apdex score to assess end-user experience
- View a breakdown of processing time for every web browser request to the application from a desktop or mobile device
- Identify if slowness is due to the network, server or content download, or browser rendering
-
Analyze Distributed Server-Side .NET Transactions
- Tag and follow every single .NET transaction across all application tiers
- Visualize the flow of business transactions through the application runtime architecture – across web servers, application servers and databases
- Measure the execution time taken by each tier and easily identify where slowdowns occur
- Using advanced hop-by-hop analysis, trace across all tiers, with no gaps
- Examine transactions through multi-tiered IIS servers, JVMs, and external service calls
-
Gain Deep Insights into .NET Code and Identify Errors
- In a single click, drill down to the .NET application code and identify errors and exceptions
- Get method-level visibility and pinpoint the exact line of code delaying transaction processing
- View error-prone, badly written and long-running database queries
- Analyze transactions from both web browsers and native mobile applications
-
In-Depth Monitoring of .NET Framework, CLR, and IIS
Get out-of-the-box monitoring for Microsoft IIS Servers, including:
- Web server HTTP errors, service request queues, cache hit rate and availability of IIS sites
- .NET Framework, application requests, cache, compile and runtime errors, SQL connections, and worker processes
- Application pool status, processes, CPU and memory utilization, threads, handles, page faults, IOPS, and more
- CLR exceptions, garbage collection, heap memory, classes loaded, AppDomains and assemblies
-
Troubleshoot Faster with Automated Root Cause Diagnosis
- Get out-of-the-box visibility throughout the entire infrastructure supporting .NET applications: SQL Server, Oracle, Active Directory, IIS, Microsoft Azure, Hyper-V, VMware, and more
- Auto-discover application-to-infrastructure dependencies and visualize topology from intuitive maps
- Automatically correlate performance insights across the infrastructure and pinpoint the root cause
-
Application Performance Monitoring for All Stakeholders
- Application owners can detect user experience and application performance issues
- IT administration teams can drill into any component (.NET, IIS, SQL Server, AD, cloud, etc.) and gain deep performance insights for troubleshooting
- DevOps teams can proactively identify performance bottlenecks and ensure faster production rollouts
- Developers benefit from quick identification of code-level and database query-level errors
- Helpdesk personnel can quickly view the entire .NET service performance at a glance, pinpoint problem areas for faster escalations

Benefits
- Ensure a great user experience and peak performance of Microsoft .NET applications
- Increase agility in responding to performance issues with deep diagnostics and actionable insights
- Reduce service-level impact by monitoring business transactions in real time
- Pinpoint complex .NET application problems and code latency in seconds
- Optimize your IT infrastructure with built-in capacity planning and right-sizing reports
Why eG? One Monitor to Manage All of IT.
- eG Enterprise is the only single pane-of-glass, virtualization-aware, auto-diagnostic IT infrastructure performance monitor
- Gain actionable answers to performance issues, wherever they originate, from application code to bare metal
- Understand the impact of infrastructure issues on application performance and user experience
- Unify IT performance monitoring, alerting, diagnosing, reporting, and capacity planning in a single console
- Ensure a great user experience and dramatically improve IT efficiency
- Benefit from flexible deployment options (on-premises and SaaS) and IT monitoring approaches (agentless and agent-based)