Using eG Enterprise you can monitor your JVMs, WebSphere containers and Java application code from a single-pane-of-glass. Get complete visibility into application performance and identify how to optimize your WebSphere deployment.
Free TrialTrusted by leading companies

eG Enterprise is a full stack application performance monitoring (APM) solution that provides in-depth performance visibility into IBM WebSphere Application Server (WAS) and the Java applications running on it. Achieve WebSphere performance monitoring from a single pane of glass, and be the first to know when there are slow application transactions, high web service response time, problems in EJB invocation, hung threads, faults in JCA Connection Pools, JVM memory leaks, and more.
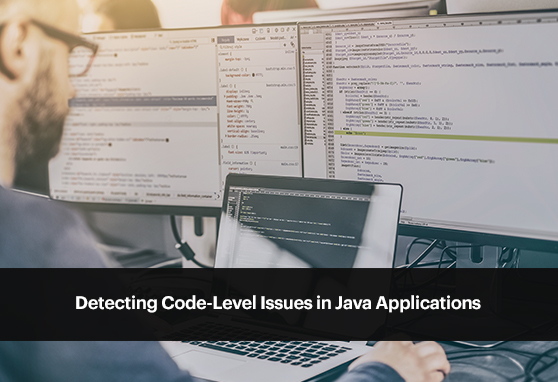
eG Enterprise helps administrators monitor WebSphere performance and understand and provide insights to troubleshoot problems before application users are affected. Developers can get immediate access to problematic Java code or SQL queries that impact application performance.


eG Enterprise helps you enhance and optimize the performance of Java applications running on IBM WebSphere. Get visibility into your full Java application stack, including the underlying infrastructure.
eG Enterprise gives us performance insight into our business-critical applications. It provides real-time and detailed visibility of every key component. With its prediction and analysis reports, we can be proactive instead of reactive.![]()

Get access to critical WebSphere performance metrics at your fingertips:

eG Enterprise WebSphere monitoring tool automatically correlates WebSphere performance with server-side issues, resource deficiency (CPU, memory, disk, etc.), hardware faults, network latency, etc.