Aspen Systems created a nice writeup of the key capabilities and value of eG Innovations for performance monitoring of complex IT environments, and we would like to share it with you: It’s no secret that there are a lot of moving pieces in today’s virtualized environments. This can bring a lot of benefits in terms of flexibility but also a lot of headaches when trying to determine the root cause of a failure, or an ongoing performance degradation issue, especially when many of these services may be sharing the same virtualization hardware.
Our environments today are a dynamic, moving target. Workloads can be spun up quickly to counter user demand and moved around dynamically based on load. Traditional SNMP-based monitoring systems were created prior to these dynamic environments, and often focus on a single server, switch, or piece of hardware. With so many inter-dependencies and shared resources involved today, it can be a challenge to view the entire service stack, and find the root cause of a outage or performance problem. eG Innovations has a unique approach to viewing all these layers, and helping us pinpoint the cause for a poor End User Experience.
eG Innovations has been doing a pretty good job of this over the years, so this is what we will be covering today in this edition of our “Brief Visual Overview” series.
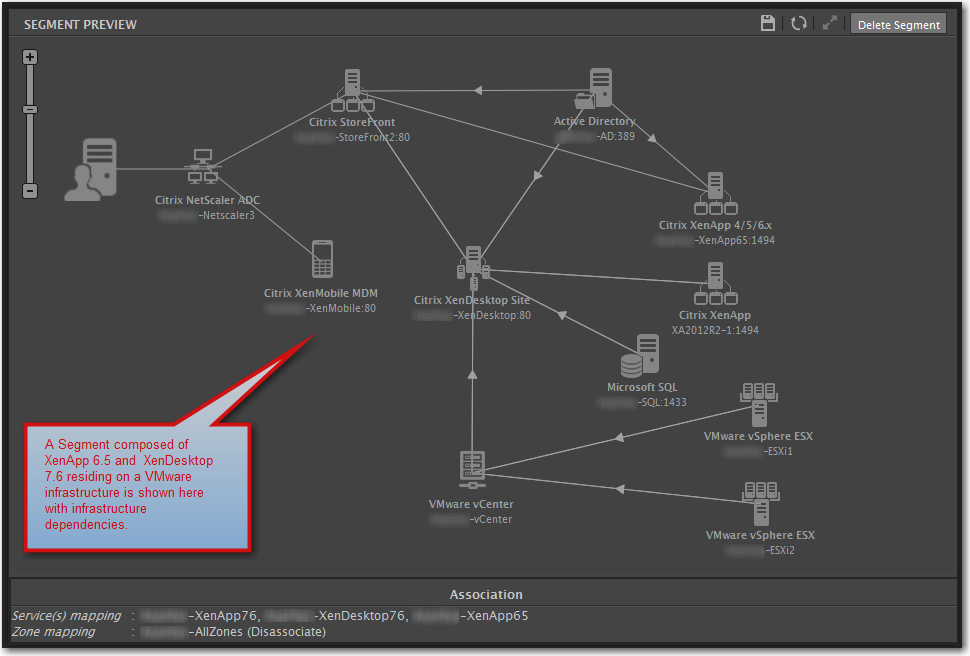
Bringing “Islands” and “Silos” Together
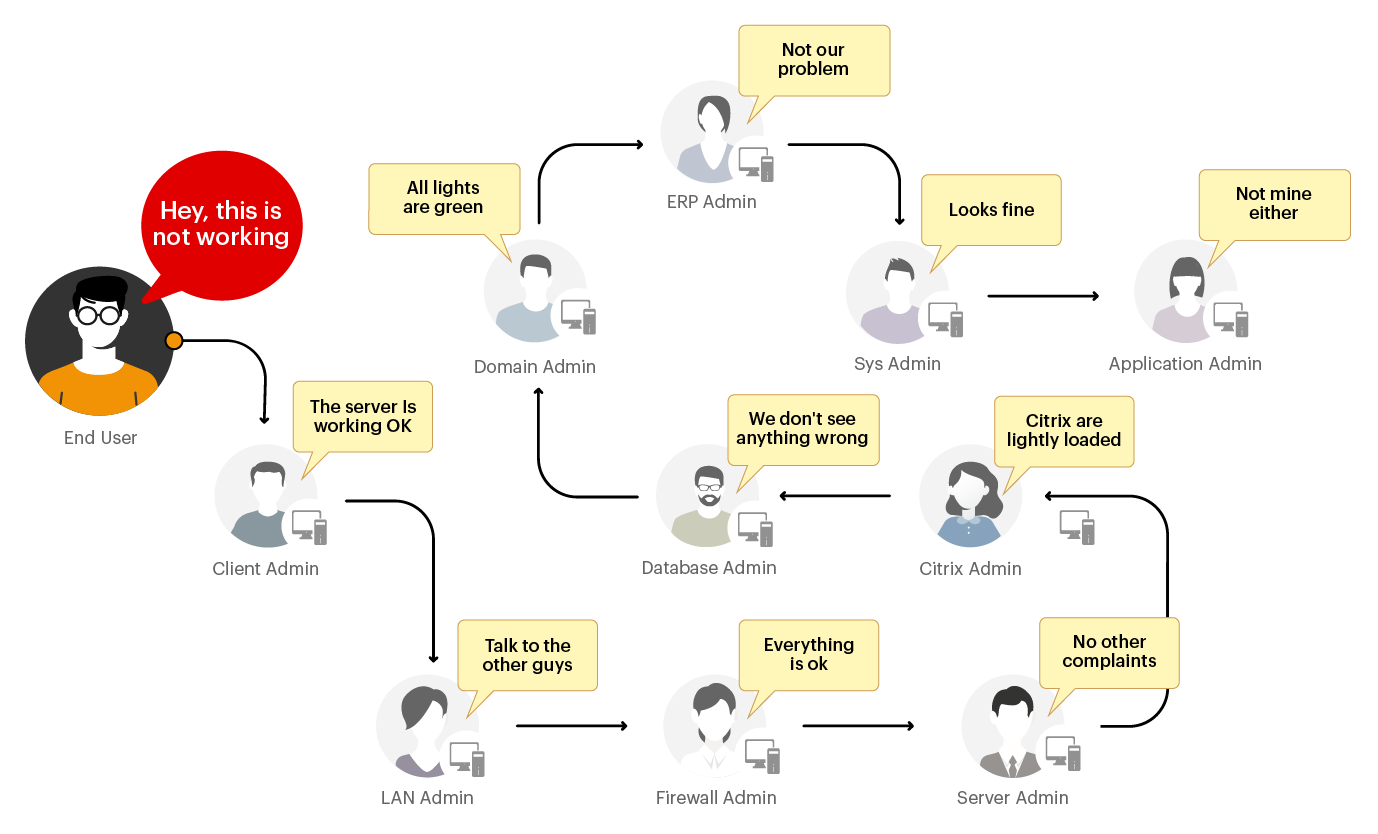
This scenario above is what we need to avoid. If this looks familiar to you, you’re not alone. Troubleshooting this kind of situation can be a long painful journey of telephone tag, “SneakerNet”, and finger pointing. In a lot of cases, these silos will be monitored by different people and different monitoring systems if they are monitored at all. If we can get our arms around monitoring the highly dependent layers, then we’ll be much further head of the game when troubleshooting, or proactively predicting problems.
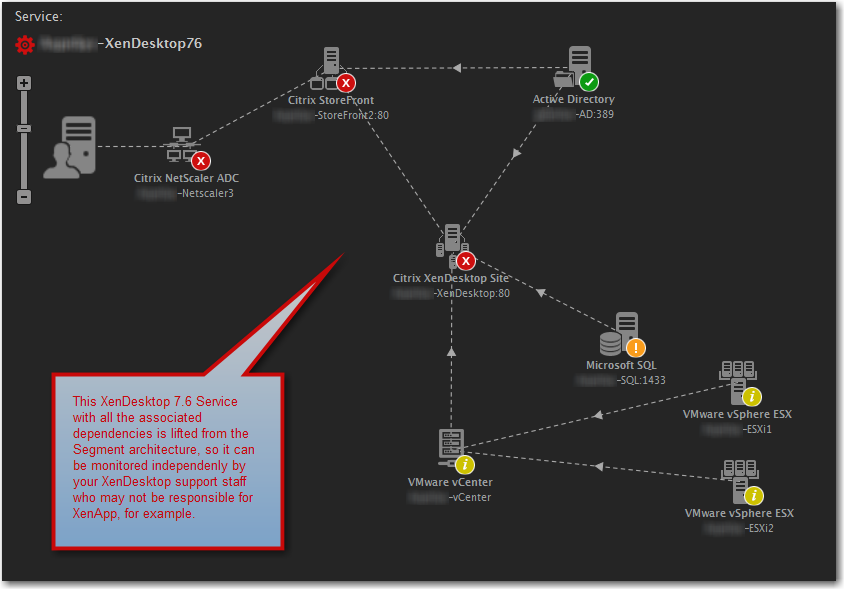
Focusing on the Layers of Service
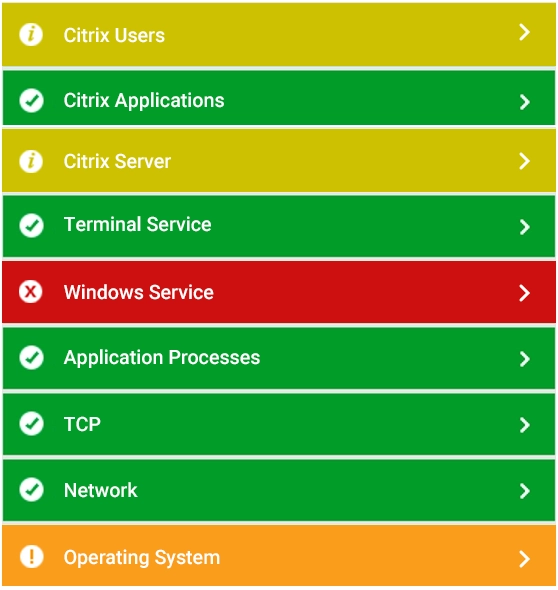
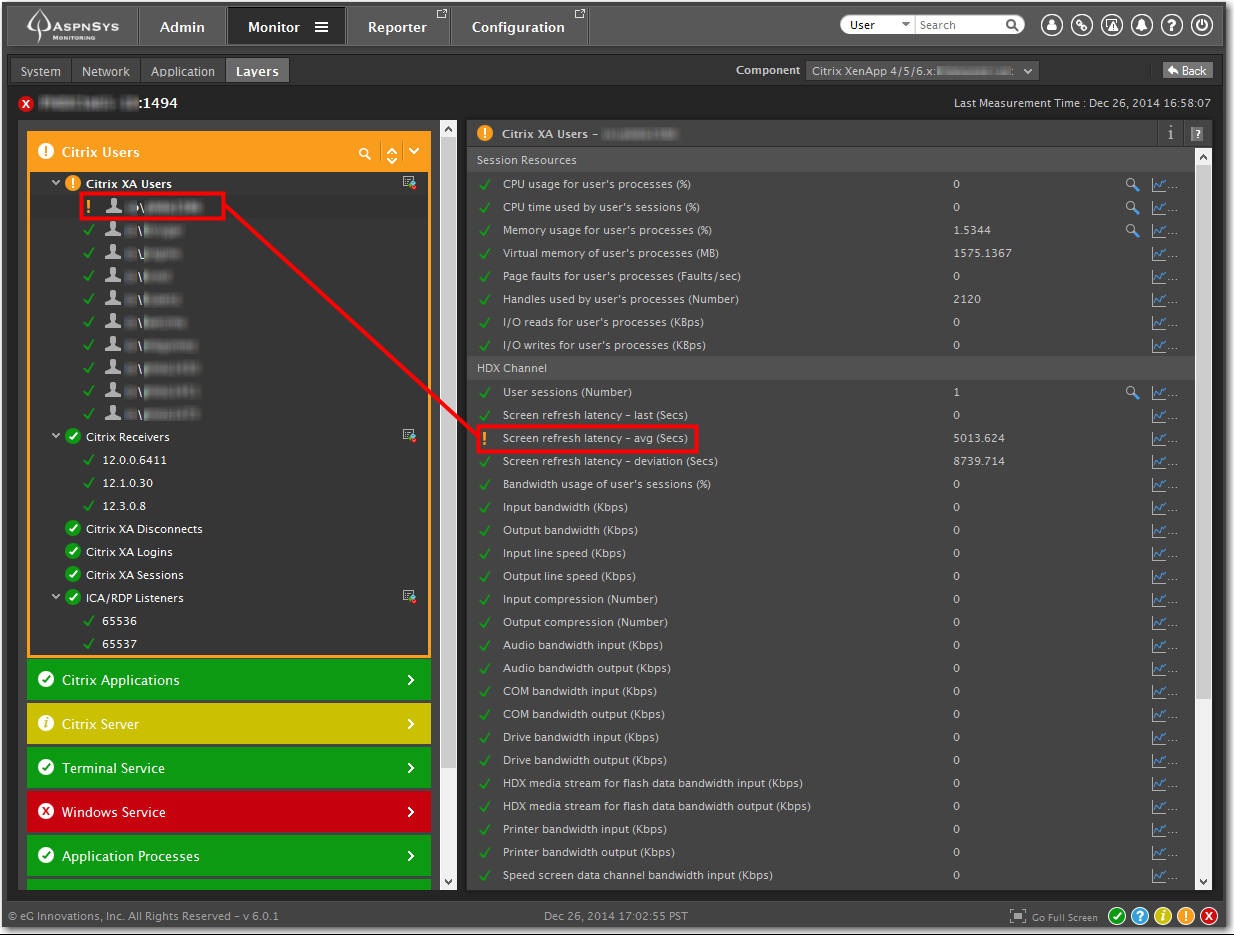
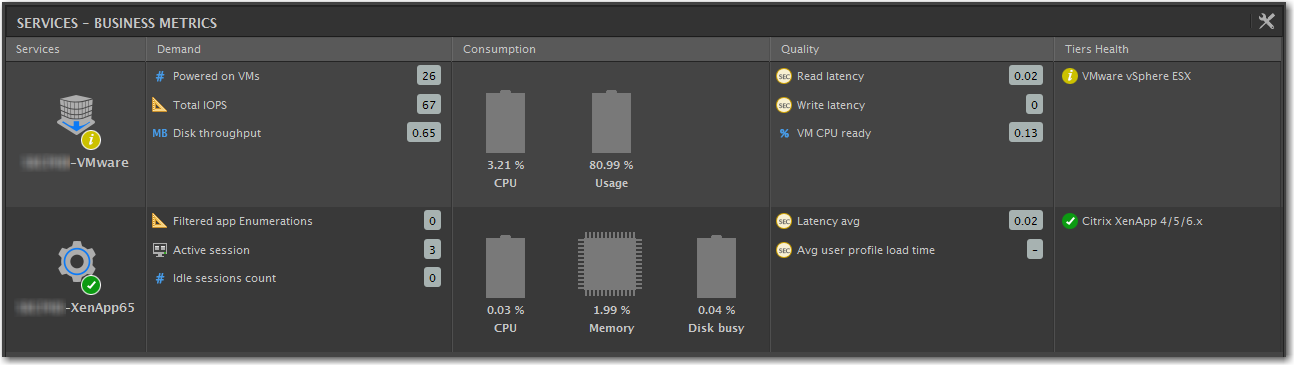
eG allows us to bring all the levels in the virtualization stack together, displaying the overall health of each one with their unique “Layer View” which can be seen below. Breaking things down in this manner allows us to easily hone in on the potential root cause of a performance issue. The health of all layers right from the physical hypervisor level right up the stack to inside the VM can easily been seen, and their status identified by color.
one more critical than the other.
Key Products & Features
- Agent or agentless monitoring
- Simple single agent licensing model
- Extensive virtualization support
- Visibility of all virtualization layers enabling easy root cause analysis
- Historical reporting and graphs
- Automatic baselining and thresholding
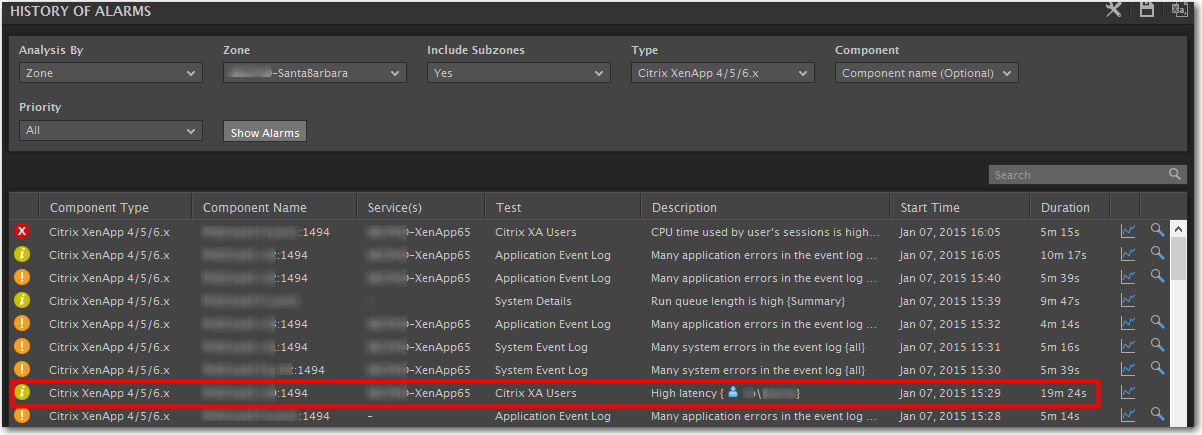
- Real-time monitoring graphs & alarms
- Pre-emptive problem detection & alerting
- Customizable dashboards
- Uses HTTP/HTTPS for all monitoring, limiting need for VPNs for remote monitoring
- Configuration tracking & logging
- Automatic topology discovery
System Dashboards
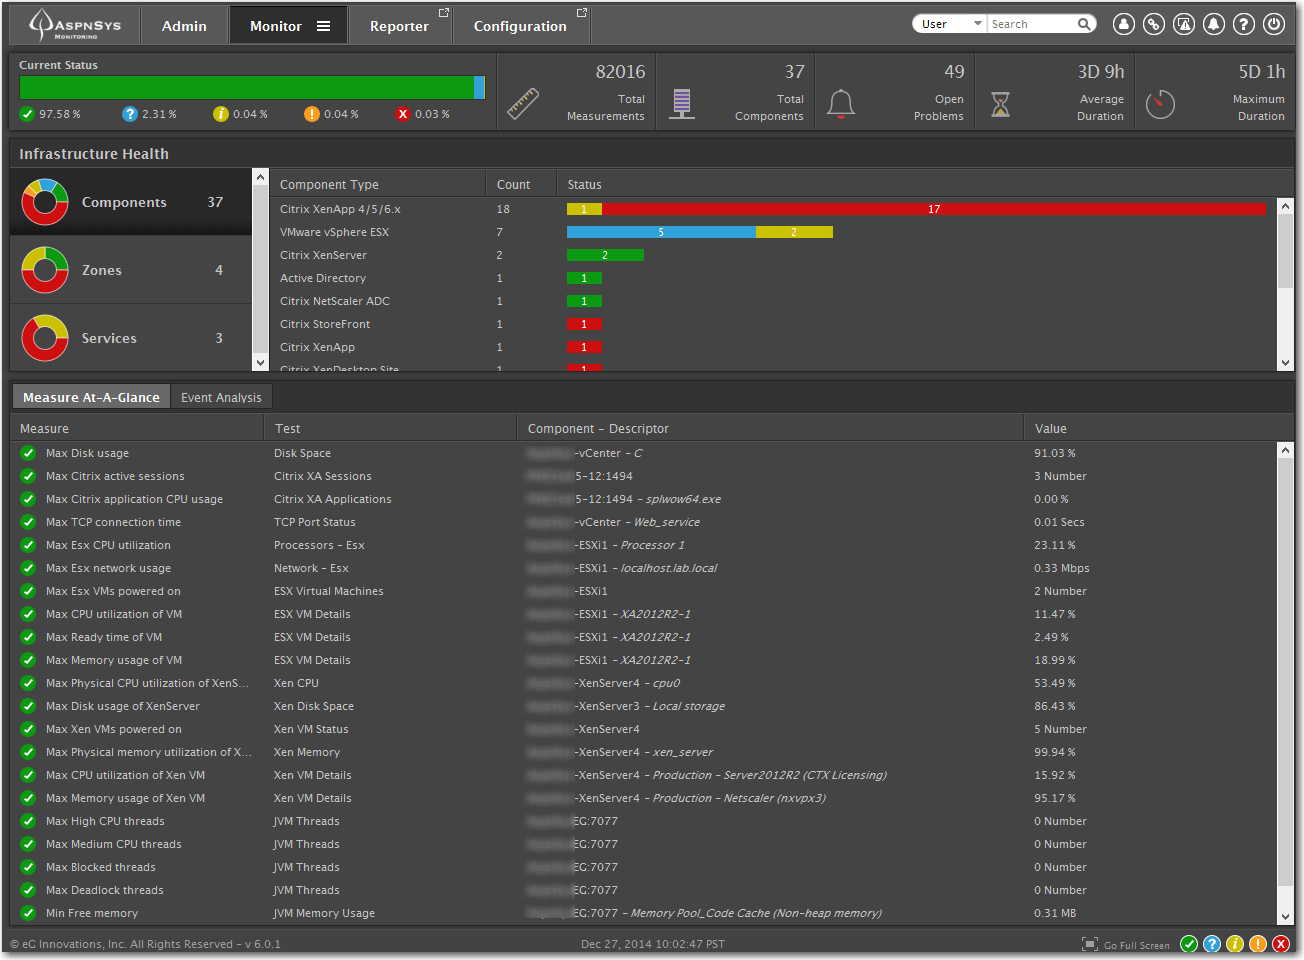
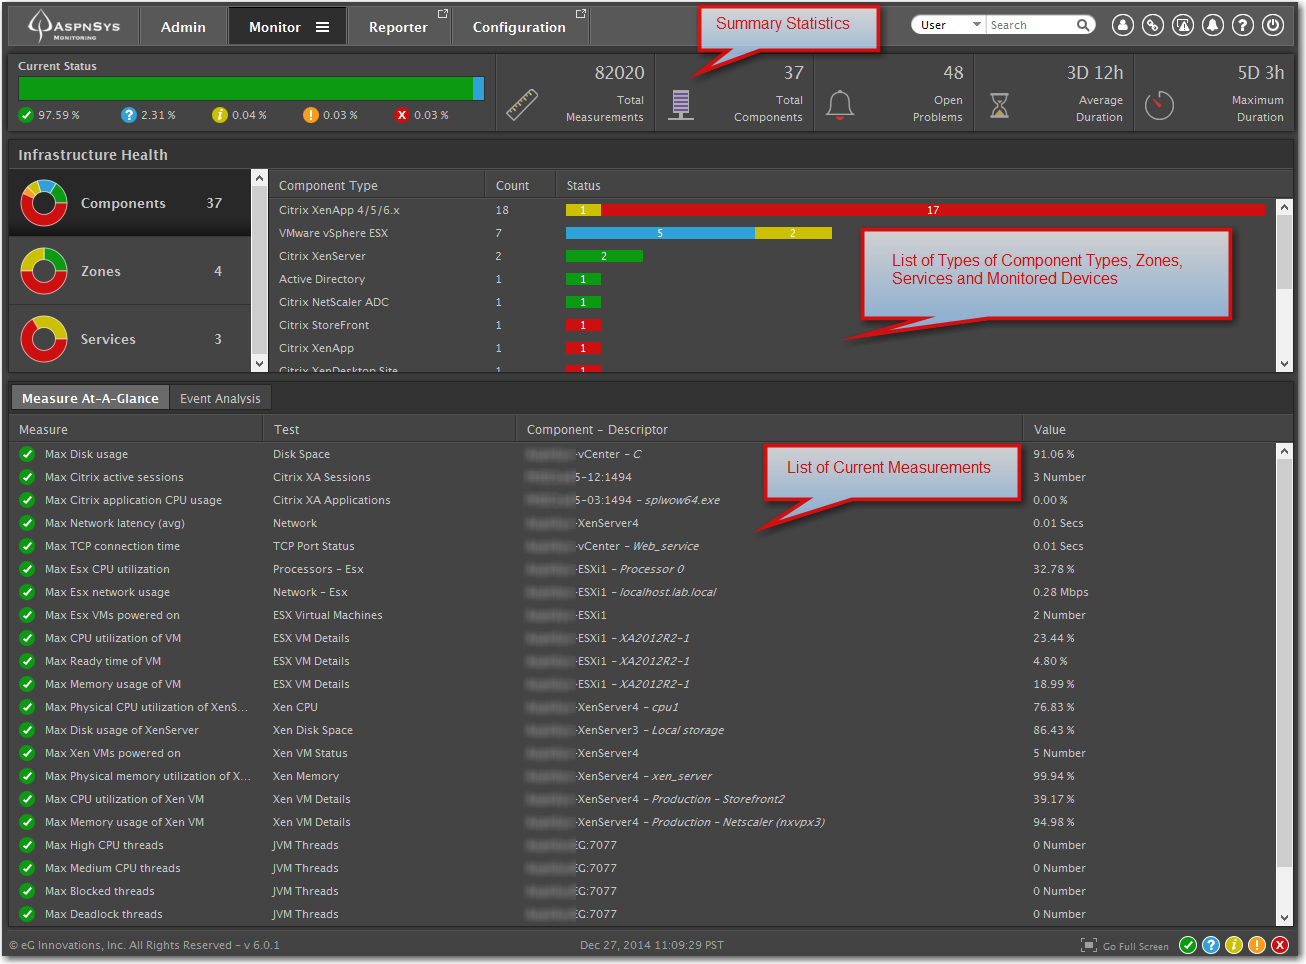
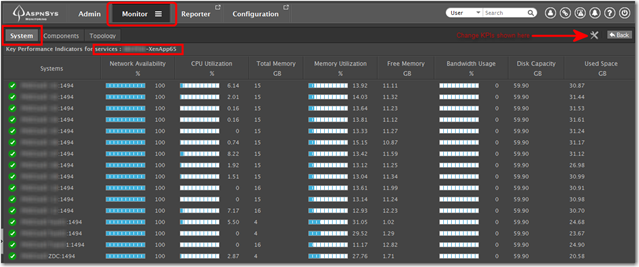
At-a-Glance Dashboard
Out of the box, there are some very informative dashboards included with the eG Enterprise solution. You can easily view the status of your hypervisors by going into the primary Monitor/System/Overview tab, which shows an “At-a-Glance” overview of statistics such as CPU Usage, storage utilization, and memory utilization. From this screen, historical statistics can also be called up as needed.
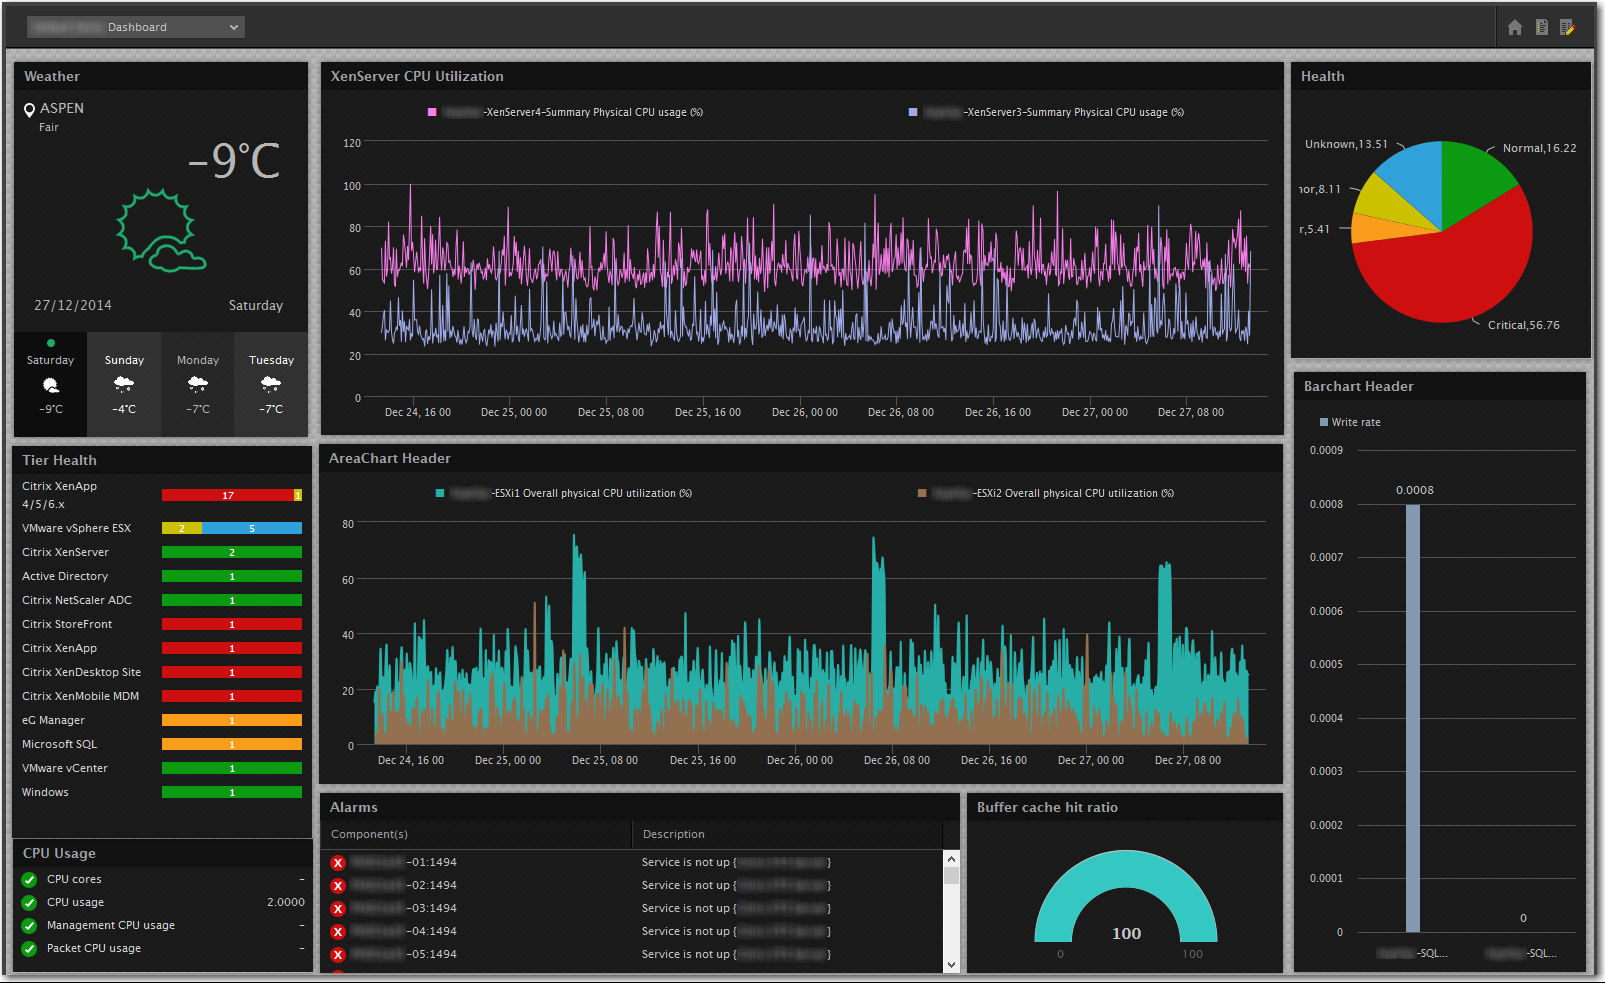
Historical View Dashboard
By changing to the “History” tab, we can easily call up performance over time so trends and important events can be tracked.
Layer View Dashboard
eG makes it easy to view trouble spots across the entire virtualization stack, from the physical hypervisor hardware all the way up the stack to the inside of a virtual machine. This helps with root cause analysis because you can quickly identify performance problems by finding the root cause of the problem.
Monitoring Agents
Types of Monitoring Agents
eG can monitor your environment using an eG monitoring agent or in “agentless” mode. When using agentless monitoring, a centralized Data Collector is responsible for collecting data from the various types of systems using the existing available protocols such as SNMP, ssh and WMI/PerfMon. This mode of operation will give you basic monitoring functionality of your environment and may be easier to deploy, if you already have services like SNMP enabled.
Note: For more information on how Agentless Monitoring works, see Agentless Monitoring
For a much deeper view into your systems an eG “Universal Agent” can be used in conjunction with an “Agent Server” that is installed on-site. This is a single, unified agent that can monitor systems regardless of platform, including VMware, XenServer, Citrix, SQL, Web services, and many others. The agent automatically updates itself as needed, and the overhead on the server is extremely small, typically <1%. If you want detailed metrics of your system that can assist with detailed troubleshooting and root cause analysis, then this is the way to go.
Note: For more information on how Universal Agent Monitoring works, see Universal Agent Monitoring
Reporting
The reporting features within eG Enterprise are very extensive, allowing for in-depth analysis of any part of your infrastructure. Core features of the Reporting module include:
- Service Level Reports
- In-Depth Performance Reports for Every Layer
- Performance Comparison Reports
- Snapshot-in-Time Reports
Very detailed reports can be created by users with appropriate access, and these reports can be saved as templates or exported to PDF/CSV, or even emailed automatically based on a schedule.
Configuring Logging & Comparison
eG Enterprise has the capability to record and track configuration changes on monitored systems in your infrastructure. This is an optional component, but in our opinion is worth the extra cost. This module is very helpful in determining if recent configuration changes led to an outage or performance degradation which all too often is the case.
Here’s a sample of how the Configuration module can help find misconfigurations and inconsistencies when comparing two vSphere hypervisor hosts:
Because configuration changes are tracked historically, you can easily see when these changes occurred most over time.
Summary
eG Innovations Enterprise is an extensive, fully featured monitoring solution that excels in monitoring virtualized environments. It greatly decreases troubleshooting time by identifying problematic layers across your virtual infrastructure and has extensive configuration and reporting modules. eG can be set up on premises or purchased as a cloud-delivered service. For smaller environments, a VMware appliance can be used, which may be a good fit for smaller environments and Proof-of-Concept deployments.
Further Reading
Here are some additional links for further reading on the eG Innovations solutions.
Key Features & Benefits
Platform Support
Installation & Service Options
- eG Enterprise Virtual Appliance
- Cloud Monitoring with eG Enterprise
- eG Enterprise On-Tap (On-Demand Critical Issue Diagnosis)
- VDI Performance Assessment
Demos, Videos & Presentations
eG Enterprise is an Observability solution for Modern IT. Monitor digital workspaces,
web applications, SaaS services, cloud and containers from a single pane of glass.
If you would like more information on how Aspen Systems can assist you with monitoring your environment, please contact us here.
eG Enterprise is an Observability solution for Modern IT. Monitor digital workspaces,
web applications, SaaS services, cloud and containers from a single pane of glass.