Delivery Controllers are at the Heart of a Citrix Environment
When the Citrix architecture moved from v6 to v7, one of the main components that was introduced in the v7 architecture was the Citrix Delivery Controller (CDC).
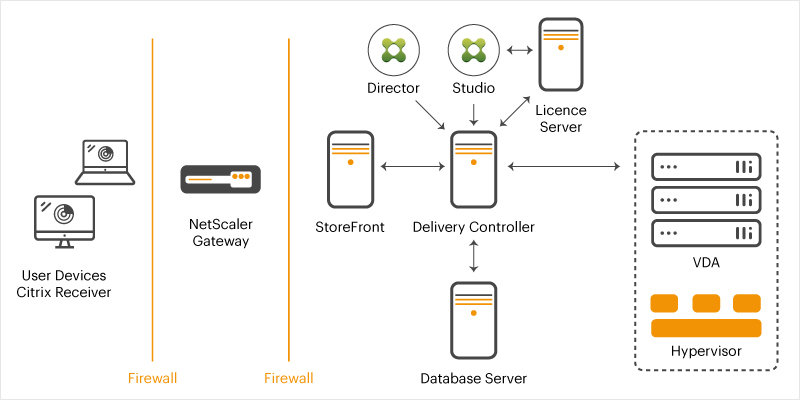
A Citrix Delivery Controller is a server-side component that is responsible for managing user access and brokering (enabling application and desktop access) and optimizing connections. Each site will have one or more delivery controllers. If the server hosting the Delivery Controller (DC) role is unavailable, your users will not be authenticated or verified; as a result, they will also not be able to access and/or launch any of their virtual desktops or published applications – so it is really a good idea to have two or more DC servers per site.
DCs are a key part of Citrix infrastructure. Delivery Controller issues are often the root cause of failed or slow logons within a Citrix environment. For those looking to really understand how DCs fit in with Citrix farm architecture, Bas Van Kaam has written a wealth of excellent information, available here. Carl Stalhood has also written a useful checklist of common problems that arise with Citrix Delivery Controllers.
Monitoring of Connection Failures, Machine Failures, and Unregistered Desktops
As it is the main component that handles assignment of users to app servers and desktops and the logon process, Citrix Delivery Controllers see all user accesses to a Citrix site. Hence, different types of connection failures – user connection failures, machine failures, unregistered desktops, etc., can be tracked from the Delivery Controllers.
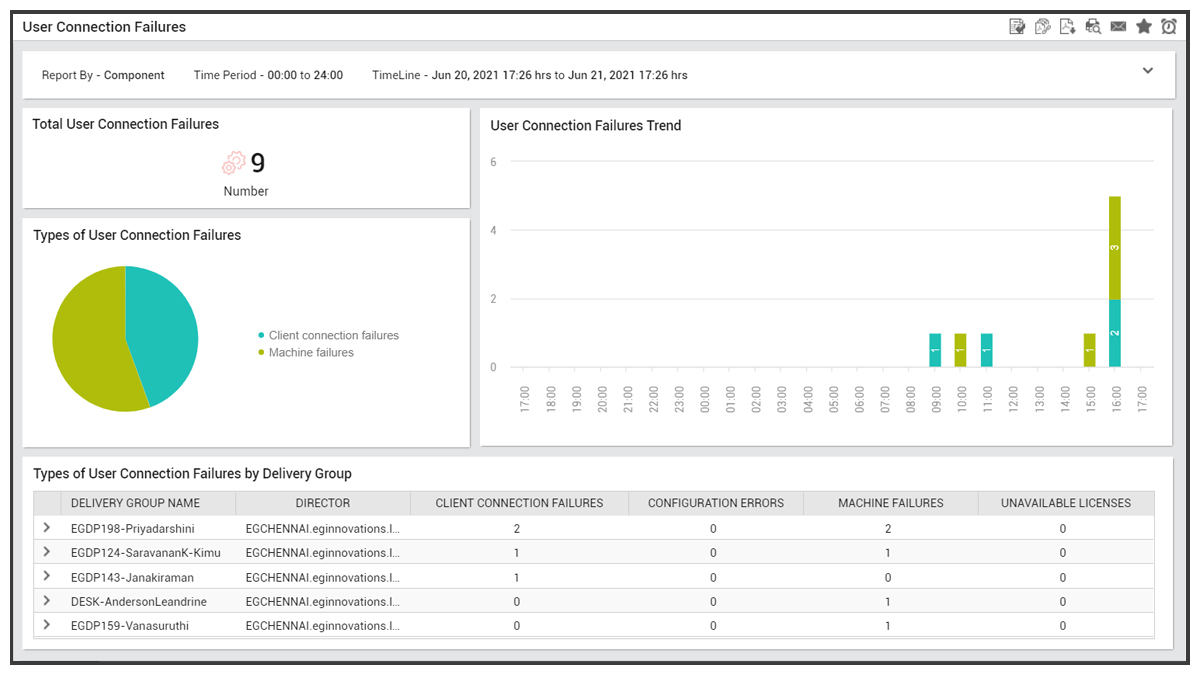
From the Delivery Controller, one can also track delivery groups and the utilization level in each group. This way, if a delivery group is running out of capacity, Citrix admins can be proactively alerted.
Monitoring of Citrix Logon Times
As it handles all user logons, the Delivery Controller is in an ideal position to track real logon times of users. When a user logs in, the Delivery Controller captures the total logon time and also the time taken for each of the phases of the logon process. These include:
- Brokering time: This is the time taken by the Delivery Controller to decide, which desktop to assign to the user.
- VM start time: If the session requires a machine start, VM start is the time taken to start the virtual machine. Otherwise, this value will be 0.
- HDX connection: This is the time taken to complete the steps required in setting up the HDX connection from the client to the virtual machine.
- Authentication: This is the time taken to complete authentication to the remote session.
- GPOs: If Group Policy settings are enabled on the virtual machines, this is the time taken to apply group policy objects during logon.
- Logon scripts: If logon scripts are configured for the session, this is the time taken for the logon scripts to be run.
- Profile load: If profile settings are configured for the user or the virtual machine, this is the time taken for the profile to load.
- Interactive Session: This is the time taken to “hand off” keyboard and mouse control to the user after the user profile has been loaded. It is normally the longest duration out of all the phases of the logon process and is calculated as Interactive Session duration = Desktop Ready Event Timestamp (EventId 1000 on VDA) – User Profile Loaded Event Timestamp (EventId 2 on VDA). Interactive Session has three subphases: Pre-userinit, Userinit, and Shell.
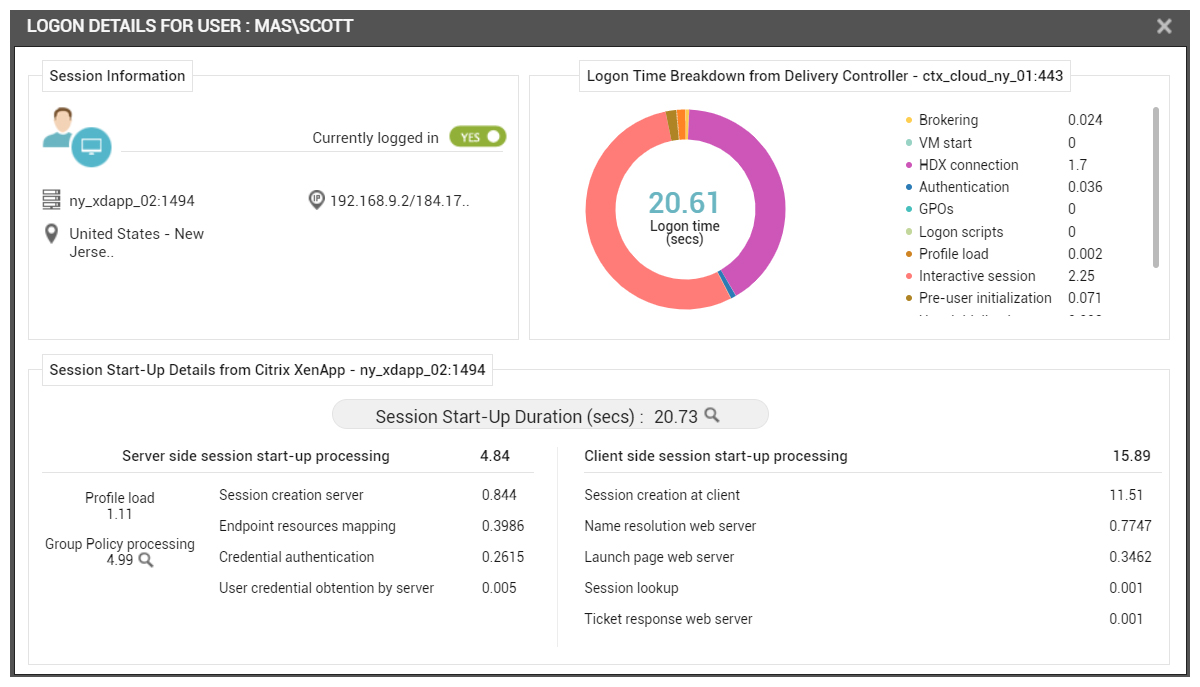
eG Enterprise integrates with Citrix APIs to collect real user logon times as measured by the Delivery Controllers. At the same time, it also collects logon processing information from within Citrix VDAs. This information allows eG Enterprise to provide a 360-degree view of logon performance – from the delivery controllers and from the VDAs. You can download our free Citrix logon simulator or you can read more about this in our whitepaper on Citrix logon performance.
Monitoring of Citrix Delivery Controller Health
As the Delivery Controllers play such a key role in a Citrix deployment, it is important to monitor their health and performance as well as their connectivity to the rest of the Citrix tiers. eG Enterprise is a Citrix monitoring tool that monitors these as part of a stack model it includes for Citrix Delivery Controller. This model is designed to be used without domain expertise, so that frontline helpdesk staff, who may not be Citrix experts can immediately identify and route issues to the team that maintains the DCs.
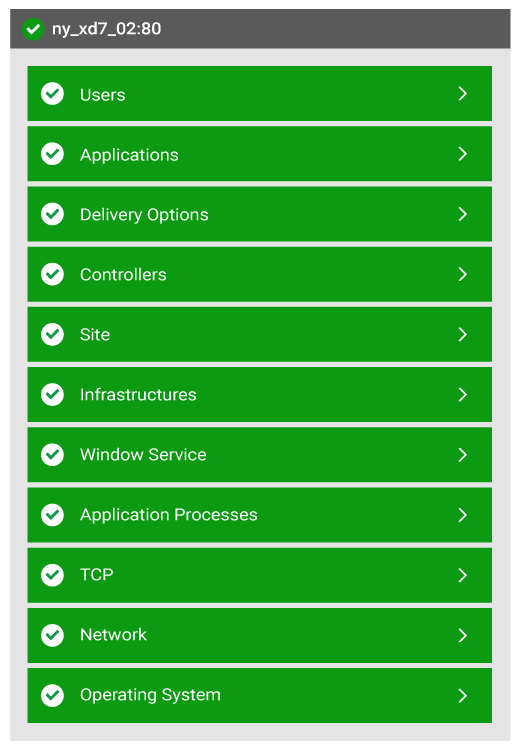
The metrics mapped to every layer of this model enable administrators to find quick and accurate answers to the following performance queries:
- Is the broker able to connect to the hosting server?
- Is any hosting server in maintenance mode? If so, which one?
- Have any controllers in the site failed? If so, which one(s)?
- Is the controller, being monitored, operating without glitches?
- Are any controllers in the farm in a powered-off state? If so, which one(s)?
- Is the controller being monitored in a powered-on/off state currently?
- Are critical services running across the site? Are they inactive on any controller on the site? If so, which one(s)?
- Are the critical site services running on the controller being monitored?
- How healthy are the interactions between the broker’s MS SQL database and critical Citrix services such as the Broker service, the Configuration service, the Configuration Logging service, the Host service, the AD Identity service, the Machine Creation service, the Citrix Delegated Admin service, the Storefront service, the Environment Test service, the Monitor service, and the Machine Identity service? Is any service unable to access the database, or is any service experiencing slowdowns while executing database transactions? Which one of these services is in an abnormal state currently?
- Have the broker’s logs captured any errors/warnings recently?
- Is any machine unable to register with the broker? If so, which one?
- How many catalogs have been configured on the broker? What are they? What is the type of each catalog?
- How many machines in each catalog have been assigned to users, and how many are unassigned?
- Does any catalog consist of machines that do not belong to any delivery group?
- Is the License server available on the site?
- Is the broker able to connect to the SQL database server?
- Is any delivery group in maintenance mode?
- Is any delivery group unavailable?
- Are there adequate idle machines in every delivery group, or is any delivery group over-utilized?
- Have any machines disconnected from their delivery groups? Which delivery groups have such disconnected machines?
- Does any delivery group consist of unregistered machines?
- Which delivery group is managing CPU-intensive machines? Which desktops are these? Which controller is managing these desktop groups?
- Are too many desktops in a desktop group experiencing network latencies?
- Did the connection attempt to any machine fail recently? If so, which machine is this? Which delivery group and controller are managing this machine?
- Are any machines in a group powered off currently?
- Is the broker overloaded with sessions?
- Have published applications been accessed in any session?
- Have too many user sessions disconnected from the broker?
- Are too many sessions to the machines logging out?
- Is any machine in an Unavailable state currently?
- Is the virtual desktop agent unavailable on any machine?
- Is any machine in the maintenance mode?
You can read more about this in our detailed documentation: https://www.eginnovations.com/documentation/Citrix-Delivery-Controller/Monitoring-Citrix-Delivery-Controller-7.htm
 |
Tip – Best practice for Delivery Controllers – ‘Have enough DDCs to handle requests.’ What numbers would you recommend?
A Delivery Controller can support up to 5,000 VDAs. If you have 10,000 VDAs, for example, deploy a minimum of 3 DDCs. You should always follow the N+1 model. This allows you to endure a Delivery Controller failure without impact. This tip is one of our many in the Citrix Troubleshooting FAQs. |
| Quick Fact – Did you know that the Active Directory plays a greater role in Citrix 7.x as compared to Citrix 6.x? In Citrix version 6.x, when the Citrix Web Interface was used as the frontend, it was the Citrix Delivery Controller (also, called XenDesktop Controller) that communicated with the AD. With the Citrix version 7.x architecture, when Citrix StoreFront is used as the front-end, both Citrix StoreFront and the Citrix Delivery Controller rely on Microsoft Active Directory. That is, the dependence on Microsoft Active Directory is higher in the Citrix 7.x architecture. For more details, check out this blog: Web Interface vs StoreFront logon process. |
eG Enterprise Feature Highlight – Detecting Time Synchronization Issues on your Citrix Site
One of the functions of the Active Directory service in a Windows domain is to be the network time source (that is, an NTP server also runs on the Active Directory server).
All devices in the domain can then synchronize their times with the Active Directory service. Over time, clocks of different systems can drift from the NTP server’s time. When this happens, it can lead to service outages.
In a Citrix site, the clocks of the VDAs and the Delivery Controllers must remain time synchronized. If the time difference between a VDA’s system clock and the Delivery Controller’s system clock is greater than the maximum difference that Kerberos allows (5 mins), communication between the VDA and the Delivery Controller will fail and the VDA will show as being unregistered in Citrix Studio (Check out https://support.citrix.com/article/CTX227517).
One of the many checks that eG Enterprise includes is a time synchronization check. If there is a significant deviation between a VDA, Delivery Controller or Cloud Connector’s clock from the NTP service, administrators will be alerted proactively.
You can find this and other similar insights in Abhilash Warrier’s blog post: The importance of Active Directory for Fast Citrix Logon Time.
eG Enterprise is an Observability solution for Modern IT. Monitor digital workspaces,
web applications, SaaS services, cloud and containers from a single pane of glass.
Related Links
- Read our documentation about monitoring Citrix Delivery Controllers 7.x and up – Monitoring Delivery Controller 7.x (eginnovations.com)
- Find out more about monitoring Citrix infrastructure with eG Enterprise: Citrix Monitoring: Built by Citrix Pros for Best Citrix Performance (eginnovations.com)
- There is quite a lot of information on identifying DC issues and also best practices in our massive guide for troubleshooting Citrix: Citrix Troubleshooting Questions & Steps | eG Innovations
 Rachel has worked as developer, product manager and marketing manager at Cloud, EUC, application and hardware vendors such as Citrix, IBM, NVIDIA and Siemens PLM. Rachel now works on technical content and engineering and partner liaison for eG Enterprise.