Monitoring Delivery Controller 7.x
Delivery Controller 7 integrates Citrix XenApp and VDI desktop virtualization technologies into a unified architecture that enables a scalable, simple, efficient, and manageable solution for delivering Windows applications and desktops. Figure 10 depicts the architecture of the Delivery Controller 7.
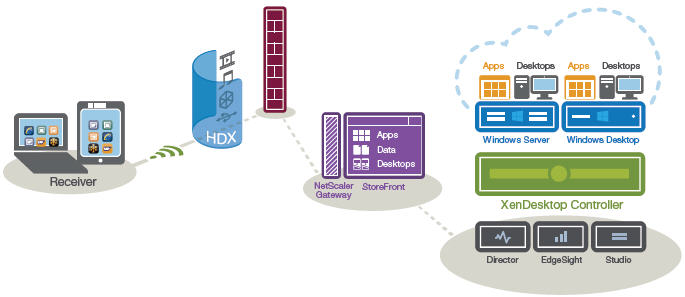
Figure 10 : The Delivery Controller 7 architecture
eG Enterprise offers a 100% web based Delivery Controller monitoring model to monitor the Delivery Controller 7 (or above) continuously and to proactively alert administrators to the the potential issues in its performance.
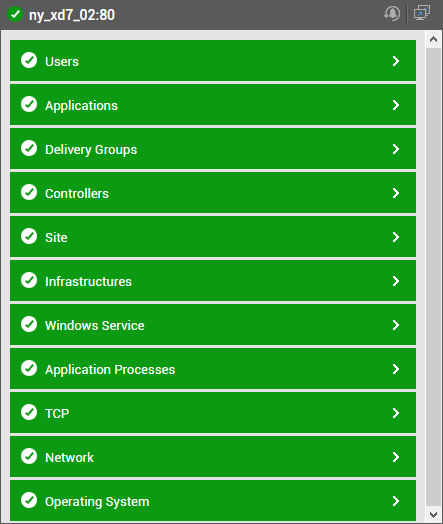
Figure 11 : Layer model of the Delivery Controller 7 server
Note:
This monitoring model reports metrics for only a single Delivery Controller in a Site. For a site-wide overview of performance, use the Citrix XA/XD Site monitoring model. To know how to monitor a Site, refer to the Monitoring Citrix XA-XD Site document.
The metrics mapped to every layer of this model enable administrators to find quick and accurate answers to the following performance queries:
- Is the broker able to connect to the hosting server?
- Is any hosting server in the maintenance mode? If so, which one?
- Have any controllers in the site failed? If so, which ones?
- Is the controller being monitored operating without glitches?
- Are any controllers in the farm in a powered-off state? If so, which ones?
- Is the controller being monitored in a powered-on/off state currently?
- Are the critical services running across the site? Are they inactive on any controller in the site? If so, which ones?
- Are the critical site services running on the controller being monitored?
- How healthy are the interactions between the broker’s MS SQL database and critical Citrix services such as the Broker service, the Configuration service, the Configuration Logging service, the Host service, the AD Identity service, the Machine Creation service, the Citrix Delegated Admin service, the Storefront service, the Environment Test service, the Monitor service and the Machine Identity service? Is any service unable to access the database, or is any service experiencing slowdowns while executing database transactions? Which one of these services is in an abnormal state currently?
- Have the broker’s logs captured any errors/warnings recently?
- Is any machine unable to register with the broker? If so, which one?
- How many catalogs have been configured on the broker? What are they? What is the type of each catalog?
- How many machines in each catalog have been assigned to users, and how many are unassigned?
- Does any catalog consist of machines that do not belong to any delivery group?
- Is the License server available on the site?
- Is the broker able to connect to the SQL database server?
- Is any delivery group in maintenance mode?
- Is any delivery group unavailable?
- Are there adequate idle machines in every delivery group, or is any delivery group over-utilized?
- Have any machines disconnected from their delivery groups? Which delivery groups have such disconnected machines?
- Does any delivery group consist of unregistered machines?
- Which delivery group is managing CPU-intensive machines? Which desktops are these? Which controller is managing these desktop groups?
- Are too many desktops in a desktop group experiencing network latencies?
- Did the connection attempt to any machine fail recently? If so, which machine is this? Which delivery group and controller are managing this machine?
- Are any machines in a group powered off currently?
- Is the broker overloaded with sessions?
- Have published applications been accessed in any session?
- Have too many user sessions disconnected from the broker?
- Are too many sessions to the machines logging out?
- Is any machine in an Unavailable state currently?
- Is the virtual desktop agent unavailable on any machine?
- Is any machine in the maintenance mode?
Since the last 5 layers of the monitoring model have already been dealt with in theUnix and Windows Servers