• Partners
    • Become a partner
    • Channel partners
    • MSP Partners
    • Technology partners
    • Register opportunity
  • Documentation
  • Blog
  • Careers
  • Contact Us
  • Search
  • English
    • English English
    • Deutsche Deutsche
    • Dutch Dutch
    • Espanol Espanol
    • Français Français
    • Portuguese Portuguese
    • 中文 中文
    • 한국어 한국어
    • 日本語 日本語
eG Innovations Logo eG Innovations LogoeG Innovations Logo
  • Products
    • Product Overview
    • How It Works
    • Monitoring as SaaS
    • Supported Technologies
    • Why eG Enterprise?
    • What's New
    • All Features
    • APM
      APM
    • Digital Workspace Monitoring
      Digital Workspace Monitoring
    • Cloud/Hybrid Cloud Monitoring
      Cloud/Hybrid Cloud Monitoring
    • Digital Experience Monitoring
      Digital Experience Monitoring
    • IT Infrastructure Monitoring
      IT Infrastructure Monitoring
    • Enterprise Application Monitoring
      Enterprise Application Monitoring
  • Solutions
    Full Stack Observability

    Single Console for Applications & Infrastructure.

    eG Enterprise is an end-to-end IT performance monitoring solution that supports over 200 different technologies.

    It consolidates your disparate, siloed monitoring tools into a single pane of glass to get you to the root-cause of performance problems quicker.

    Role-based access control means everyone on the team can monitor their area of responsibility and create customized dashboards unique to their requirements.

    When problems arise, eG Enterprise has already mapped your interdependencies and automatically correlates application and infrastructure performance to pin-point the root-cause.

    End-to-End Monitoring for Digital WorkSpaces

    Deliver the ultimate end-user experience by proactively addressing virtual application and desktop performance issues before your employees notice.

    • Citrix Monitoring

    • Citrix Cloud Monitoring

    • VMware Horizon Monitoring

    • AVD Monitoring

    • Amazon WorkSpaces Monitoring

    • Amazon AppStream Monitoring

    • Microsoft RDS Monitoring

    • IGEL Monitoring

    • VDI Monitoring

    • Nerdio Integration

    • Microsoft AVD Monitoring

    Trace User Accesses End-to-End Optimize Application Performance

    Deliver high performance applications that are deployed on the cloud, on-premises or in hybrid, multi-cloud environments.

    • Java APM

    • .NET APM

    • PHP APM

    • Node.js APM

    Single Pane of Glass for All Public Cloud Services

    Consolidate your public cloud monitoring into a single dashboard and correlate the root-cause of problems even for hybrid or multi-cloud deployments.

    • AWS Monitoring

    • Azure Monitoring

    • Alibaba Monitoring

    Full Stack Observability for Containerized Environments

    Full visibility into orchestration, worker nodes, containers, application running on them and the underlying infrastructure.

    • Docker Monitoring

    • Kubernetes Monitoring

    Get 360° Visibilty of Virtual Machine Performance Virtual Machine Visibility

    Unified console for monitoring virtual platforms which analyzes virtualization performance within the context of the business services that it supports.

    • VMware ESX Monitoring

    • Hyper-V Monitoring

    • Nutanix AHV Monitoring

    • RHEV Monitoring

    • Solaris LDoms Monitoring

    • Oracle VM Monitoring

    • Citrix Hypervisor Monitoring

    High Performance Web Server Monitoring

    Track performance and usage by web sites and transactions, error URLs, traffic, queues, slow requests and more in a single console.

    • Microsoft IIS Monitoring

    • Apache Monitoring

    • Nginx Monitoring

    Full Stack Visibility into Web Application Server Performance

    Monitor all aspects of application server performance: JVM, web containers, application transactions and more.

    • Tomcat Monitoring

    • WebLogic Monitoring

    • WebSphere Monitoring

    • JBoss Monitoring

    • SAP NetWeaver AS Monitoring

    • JEUS Monitoring

    Unified and Integrated Server Monitoring

    Track all key performance indicators of server performance from a central web console and get proactive alerts.

    • Windows Server Monitoring

    • Linux Server Monitoring

    • Solaris Server monitoring

    • HP-UX Server Monitoring

    • IBM AIX Server Monitoring

    • Server Hardware Monitoring

    In-Depth Database Performance Monitoring and Insights

    Get visibility into all aspects of database performance - workload, configuration, memory buffers, I/O operations, queries, and deadlocks.

    • SQL Server Monitoring

    • Oracle Database Monitoring

    • MySQL Monitoring

    • Sybase Monitoring

    • MongoDB Monitoring

    • MariaDB Monitoring

    • PostgreSQL Monitoring

    • SAP HANA Monitoring

    • IBM DB2 Monitoring

    • Azure SQL Monitoring

    • Snowflake Monitoring

    Insights into Every Layer, Every Tier of your IT Infrastructure

    Monitor network, server, storage, cloud, containers and more. AIOps-powered insights make monitoring and diagnosis easy.

    • Active Directory Monitoring

    • Azure AD Monitoring

    • Network Monitoring

    • Storage Monitoring

    • Citrix ADC Monitoring

    Customized Monitoring of Enterprise Applications and SaaS

    Get in-depth insights and proactively monitor and troubleshoot a wide spectrum of enterprise applications and SaaS services.

    • Office 365 Monitoring

    • SharePoint Monitoring

    • Microsoft Exchange Monitoring

    • SAP Monitoring

    • PeopleSoft Monitoring

    • AllScripts Monitoring

    • Moodle Monitoring

    • Cerner Monitoring

    Vendor-specific Monitoring Solutions

    • Microsoft Monitoring

    • Red Hat Monitoring

    Industry Solutions

    eG Innovations offers specialized IT performance monitoring for a range of industries to help IT teams deliver what their businesses expect of them.

    • Healthcare

    • Education

    • Government

    • Banking & Finance

    • Credit Unions

    • Manufacturing

    • Retail

    • MSPs

  • Solutions
    • By Technology
      Digital Workspace Monitoring
      Citrix Monitoring Citrix Cloud Monitoring VMware Horizon Monitoring AVD Monitoring Amazon WorkSpaces Monitoring Amazon AppStream Monitoring Microsoft RDS Monitoring IGEL Monitoring VDI Monitoring Nerdio Integration
      Application Monitoring
      Java APM .NET APM PHP APM Node.js APM
      Cloud Monitoring
      AWS Monitoring Azure Monitoring Alibaba Monitoring
      Container Monitoring
      Docker Monitoring Kubernetes Monitoring
      Virtualization Monitoring
      VMware ESX Monitoring Hyper-V Monitoring Nutanix AHV Monitoring RHEV Monitoring Solaris LDoms Monitoring Oracle VM Monitoring Citrix Hypervisor Monitoring
      Web Server Monitoring
      Microsoft IIS Monitoring Apache Monitoring Nginx Monitoring
      App Server Monitoring
      Tomcat Monitoring WebLogic Monitoring WebSphere Monitoring JBoss Monitoring SAP NetWeaver AS Monitoring JEUS Monitoring
      Database Monitoring
      SQL Server Monitoring Oracle Database Monitoring MySQL Monitoring Sybase Monitoring MongoDB Monitoring MariaDB Monitoring PostgreSQL Monitoring SAP HANA Monitoring IBM DB2 Monitoring Azure SQL Monitoring Snowflake Monitoring
      SaaS/Enterprise Monitoring
      Office 365 Monitoring SharePoint Monitoring Microsoft Exchange Monitoring SAP Monitoring PeopleSoft Monitoring AllScripts Monitoring Moodle Monitoring Cerner Monitoring
      Infrastructure Monitoring
      Active Directory Monitoring Azure AD Monitoring Network Monitoring Storage Monitoring Citrix ADC Monitoring
      Server Monitoring
      Windows Server Monitoring Linux Server Monitoring Solaris Server Monitoring HP-UX Server Monitoring IBM AIX Server Monitoring Server Hardware Monitoring
    • By Vendor
      Microsoft Monitoring Red Hat Monitoring
    • By Industry
      Healthcare Education Government Banking/Finance Credit Unions Retail Manufacturing MSPs
  • Pricing
  • Resources
    Solution Briefs Case Studies White Papers Expert Reviews E-Books Webinars Demos Infographics
  • About
    About Us Customers Product Support Press Releases Events Awards
  • Partners
    Become a Partner Channel Partners MSP Partners Technology Partners Register Opportunity
  • Documentation
  • Blog
  • Careers
  • Contact Us
  • Free Trial
Free Trial Toggle Menu

Tips for Troubleshooting Citrix Logon Problems

Vinod Mohan
Vinod Mohan
Published on: June 2, 2017
Last updated on: November 3, 2022
Tips for Troubleshooting Citrix Logon Problems

IN THIS BLOG POST

  • Two Easy Methods to Diagnose and Fix Citrix Logon Problems
  • #1 Reactive Troubleshooting with Real User Logon Monitoring
  • #2 Proactive Troubleshooting with Synthetic Logon Monitoring

Two Easy Methods to Diagnose and Fix Citrix Logon Problems

One of the most challenging tasks for a Citrix administrator is troubleshooting Citrix logon problems. Citrix session logon is the very first step that a user performs when connecting to a Citrix farm to access virtual desktops or applications. When logon fails or is slow, it directly impacts the productivity of the user.

52% of respondents to the recent survey of Citrix professionals by eG Innovations and DABCC ranked slow logon as the most common user complaint.

There are over a dozen steps in the Citrix logon process (this is true for both Citrix XenApp and XenDesktop), and slowness in any one of these steps can make Citrix logon slow. Furthermore, many of these steps rely on external servers and services (e.g., authentication on Active Directory, profile loading from a profile server, etc.). This makes logon troubleshooting a challenge for Citrix admins, as they must determine the root cause of the problem for effective resolution. In this article, we will look at two ways to easily detect, diagnose and triage Citrix logon issues.

#1 Reactive Troubleshooting with Real User Logon Monitoring

When a Citrix user calls in to report a logon issue, the IT staff must be able to immediately diagnose it in real time and identify the cause. An essential requirement for fast response is a Citrix real-time monitoring and historical reporting solution that provides immediate visibility into every Citrix user logon. Ideally, the monitoring solution must be able to track the overall logon time and, additionally, provide a breakdown of which step in the logon process was slow.

Slow logon is one of the toughest problems for #Citrix admins to solve. Learn how you to troubleshoot slow #XenApp and #XenDesktop logons in two easy ways.
Click to Tweet

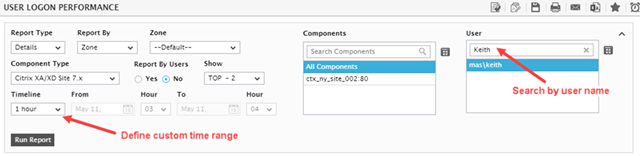
With this data in place, it is then possible to equip operations personnel with the details they need to troubleshoot slow Citrix logons. For example, when a user “Keith” calls, complaining of slow Citrix logons, the administrator can access a Citrix logon performance report from the web console that provides details on Keith’s recent logons (past hour or any custom period). This analysis of Keith’s historical logon details can be performed even if he is not still logged into the Citrix farm.

eG Enterprise - User Logon Performance

There are various steps involved in enabling Citrix XenApp logon: brokering, VM start, HDX connection establishment, AD authentication, Group Policy processing, logon script execution, profile loading, interactive session processing, etc. A problem in any one of these steps will cause logon slowdown.

Using a logon performance report, the Citrix admin can view the processing time for each logon step and identify the exact step that is causing a slowdown – allowing the team to focus on troubleshooting the issue rather than spending time diagnosing it.

eG Enterprise: Citrix Logon Duration

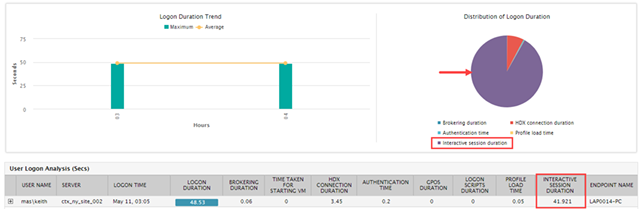
From the above example, we can see that the interactive session duration for the user Keith is very high in comparison to the other logon steps. This gap allows the administrator to confirm the issue reported by Keith and, further, pinpoint the exact step of the logon causing the slowdown.

Going deeper into analyzing the cause of slowness, the administrator can diagnose why interactive session duration is so high. With the new FlexCast Management Architecture (FMA) in Citrix XenApp and XenDesktop 7.x, logon processing occurs in two places:

  • The Delivery Controller, which is responsible for managing user access, brokering and optimizing connections
  • The XenApp server or XenDesktop VM where the Citrix session gets created, the drive gets mapped, and user credentials are authenticated

To troubleshoot Citrix logon issues, visibility into logon processing actions in both the Delivery Controller and the XenApp server/XenDesktop VM is necessary.

  • The breakdown of logon time as shown above is the view obtained from the Citrix Delivery Controller.
  • The figure below shows the drilldown capability available – for viewing the metrics obtained from the XenApp server/XenDesktop VM to further troubleshoot this issue.

eG Enterprise - Citrix Logon Performance Drilldown

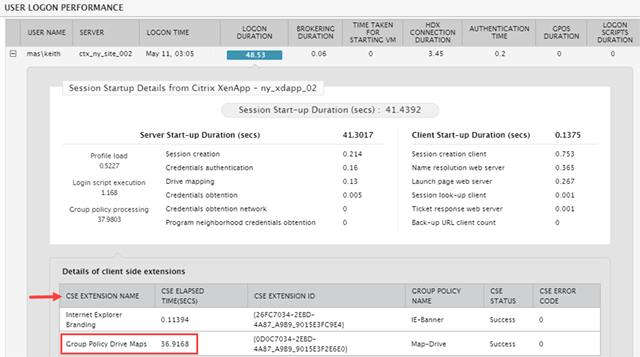
In this example, clearly most of the processing time is spent handling Group Policies. The details provided in this drilldown highlight that one of the client-side extensions (CSE) is responsible for the slowdown.

This example highlights how, in just a couple of clicks, the Citrix admin can identify the exact cause of Citrix logon slow performance. Using an effective Citrix monitoring solution, helpdesk personnel can identify logon issues without assistance, reducing the troubleshooting effort required by Citrix administrators.

#2 Proactive Troubleshooting with Synthetic Logon Monitoring

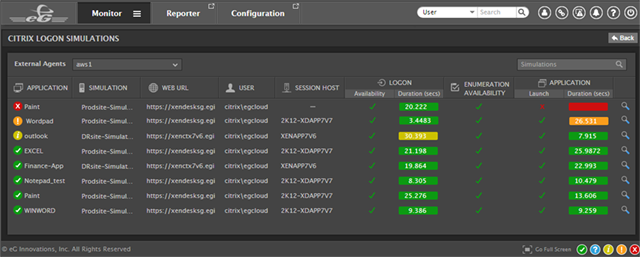
Citrix administrators are constantly looking for ways to be proactive – detecting and fixing performance issues before users notice. Real user monitoring, as shown earlier, is useful to detect issues after they happen. But to help Citrix administrators proactively identify logon issues, a Citrix logon simulator can be used.

Using synthetically simulated logon scenarios and testing them from remote locations, administrators can proactively find and fix issues before real users and business services are affected. A logon simulator tracks the time taken for each step of the logon process during the simulation and highlights the exact step causing a slowdown. This can also be used to:

  • Benchmark logon performance
  • Compare logon performance across locations
  • Test for logon issues before production updates

eG Enterprise: Citrix Logon Simulator

eG Enterprise is a Citrix Ready performance management suite that combines both real user logon monitoring and synthetic logon simulation to deliver a comprehensive solution for identifying, diagnosing and resolving Citrix logon issues.

You may also like

There’s power in your data – 5 Secrets to solving Citrix Problems

by Wendy Howard

Citrix Logon Simulator Updates
– eG Enterprise v7.2

by Swaminathan J

How to Improve Citrix Latency

by George Spiers

eG Enterprise is an Observability solution for Modern IT. Monitor digital workspaces,
web applications, enterprise applications, SaaS services, cloud and container platforms,
virtualization, storage and more from a single pane of glass.

Free Trial  See the platform

Related Blogs

There’s power in your data – 5 Secrets to solving Citrix Problems
Citrix Monitoring

There’s power in your data – 5 Secrets to solving Citrix Problems

Wendy Howard
by Wendy Howard
May 9, 2023
Citrix Logon Simulator Updates  –  eG Enterprise v7.2
Citrix Monitoring

Citrix Logon Simulator Updates
– eG Enterprise v7.2

Swaminathan J
by Swaminathan J
April 4, 2023
Performance and User Experience Monitoring for Citrix Linux Workspaces
Citrix Monitoring

Performance and User Experience Monitoring for Citrix Linux Workspaces

Barry Schiffer
by Barry Schiffer
March 9, 2023
Discover, Diagnose, and Resolve IT Performance
Issues with Full Stack Observability
Get Started

PRODUCT

How It Works Key Features SaaS Deployment Supported Technologies Pricing Benefits Why choose eG New! eG Enterprise v7

Solutions

Application Performance Monitoring Citrix Monitoring Cloud Monitoring Container Monitoring Digital Experience Monitoring Digital Workspace Monitoring Enterprise Application Monitoring IT Infrastructure Monitoring Microsoft Monitoring Microsoft SCOM Management Pack Specialized Monitoring for MSPs

Resources

Demos Webinars White Papers Case Studies Expert Reviews Alternatives Media Kit

Company

About Us Customers Partners Support Documentation Press Releases Awards Careers Blog Events Contact Us>

eG Innovations, Inc.,
33 Wood Ave. South, Suite 600, Iselin,
NJ 08830, USA Phone: +1 (866) 526 6700

eG Innovations B.V.,
WTC, Den Haag, Prinses Margrietplantsoen 33,
2595 AM Den Haag,
The Netherlands Phone: +31 (0)70-2055210

© 2023 eG Innovations. All rights reserved.

Privacy Policy  |  Terms of Use