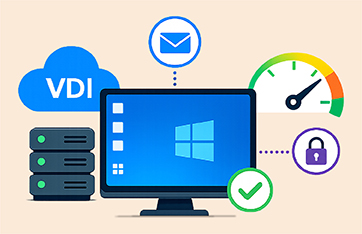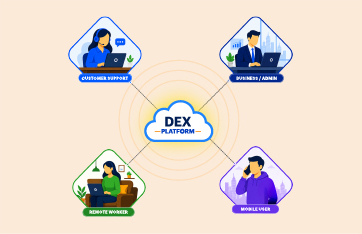
Digital Employee Experience (DEX) and the end user experience is growing in importance. IT teams must ensure that users are satisfied and productive. Many organizations are either moving to hybrid, remote or work-from-home set ups or consolidating end user support teams to support multiple branch offices – this means IT teams are responsible for supporting remote end users if the applications and services are slow or unresponsive. eG Enterprise monitoring of physical desktops (Windows laptops, PCs) allows IT support teams to troubleshoot remote workers’ problems easily by providing data on physical endpoints including resource usage, home Wi-Fi, ISP quality and last mile connections.
What is the Last Mile? (When Monitoring Physical Endpoints)
The last mile, in the context of telecommunications technology, refers to the gap between a broadband internet service provider’s (ISP’s) infrastructure and a customer’s home or workplace. Last mile connectivity is one of the biggest challenges many businesses and homeowners face when trying to access broadband services outside of urban areas. It is also often the weakest link and often reliant on legacy infrastructure and where network bottlenecks frequently impact end user experience.
Often application issues are caused by problems with ISPs, either in the last mile or within the end user’s home. Common problems at the user end which can affect users include:
- Resource issues on the user’s laptop e.g., insufficient RAM causing continual memory paging can appear very similar to internet problems to an end user
- Home WiFi issues – perhaps caused by a badly positioned router, contention with the neighbors or even interference from home microwaves or baby monitors
- ISP problems, in some geographies local internet services vary greatly in capacity and quality and can be unreliable, especially if local infrastructure such as local exchanges or networks are at or over capacity
In many organizations, it is the same team which handles both physical and virtual desktops, who need to be able to monitor and report on performance with a unified tool.
Enhanced Support for Monitoring Physical Desktops in
eG Enterprise
eG Enterprise v7.2 now supports the monitoring of physical desktops alongside virtual workspaces, with features including:
- Out-of-the-box metric thresholds and alerting with no need for manual alert configuration
- Rich dashboards that provide overviews but also detailed per-user analysis to aid helpdesk support call workflows
- Continual monitoring of key user experience and network metrics including Wi-Fi strength, ISP latency, router latency, internet latency, user logon time breakdowns and more
- End-point hardware and OSs resource usage metrics including RAM, CPU, GPU, network, disk usage and more
- Live and historical reporting with ready-to-go pre-built reports
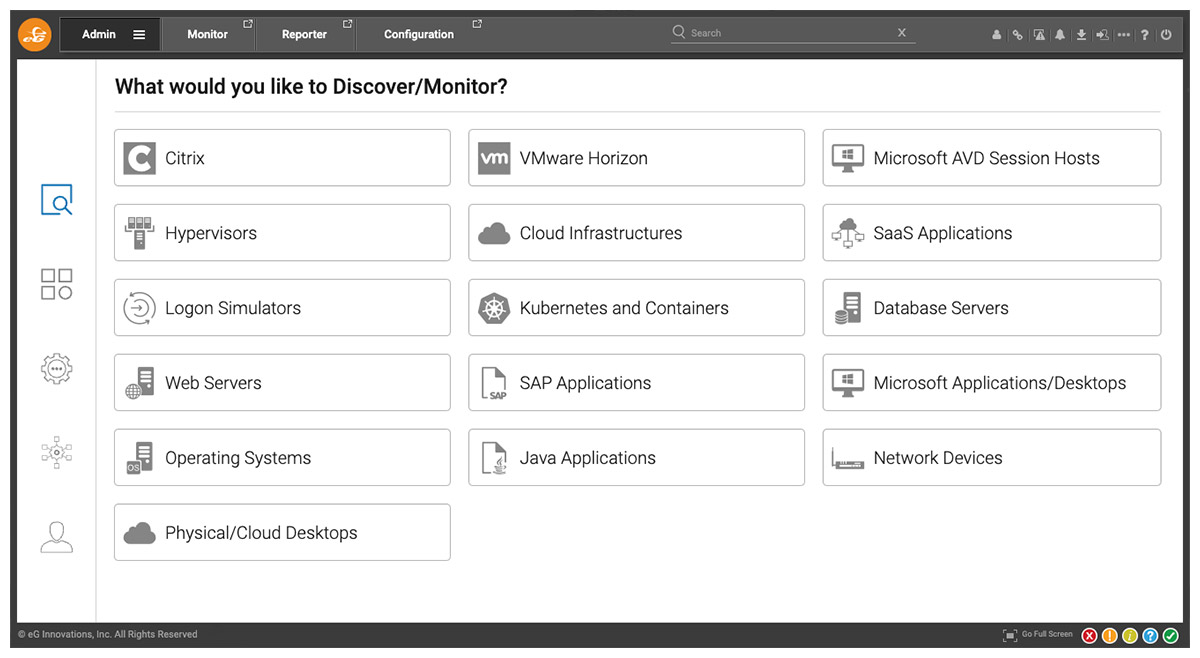
Getting Started Monitoring Physical Desktops
It’s easy to add physical desktop groups from the eG Enterprise Admin tab on the main console. Full details are given in the product documentation, see How to Monitor Physical Desktop Group Using eG Enterprise? (eginnovations.com).
Monitoring windows desktops and laptops is easy because of the minimal configuration and the low resource overhead used to collect data. Your users won’t notice a difference, and there’s not a lot of time spent packaging or installing.
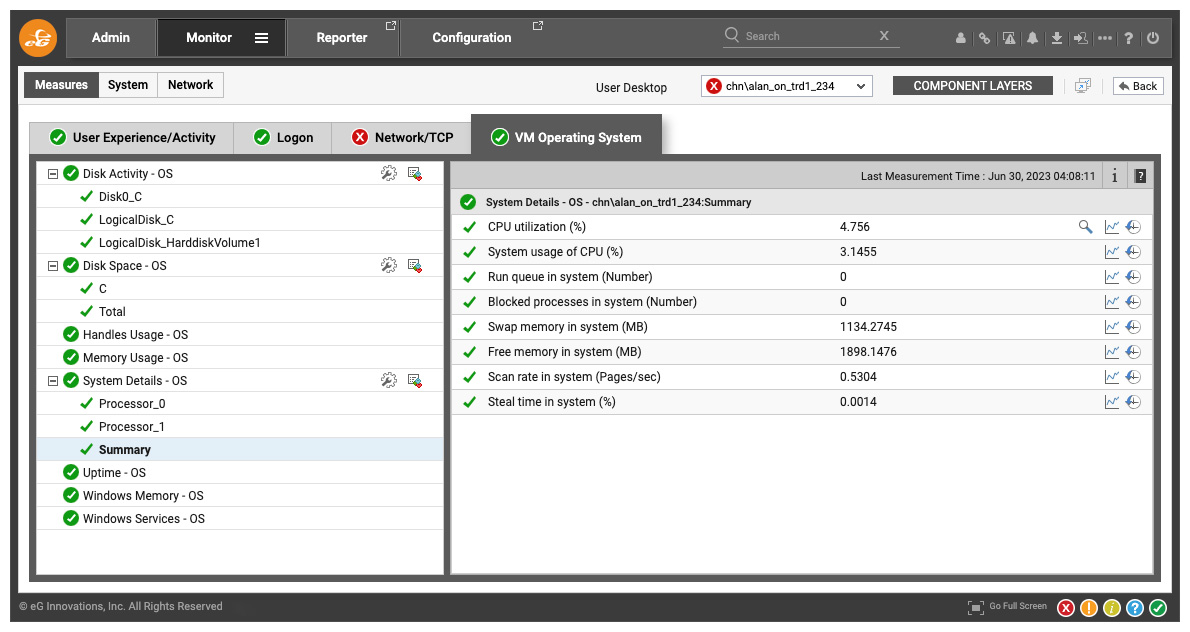
Monitoring and Alerting for the Key Metrics of Physical Desktops
Desktop performance metrics that are automatically collected with eG are: browser resource usage, GPU utilization, application launch times and more. By collecting all of these endpoint metrics, eG is enabling desktop admins to diagnose end user problems with empirical data.
| Operating System | Network/TCP | Events |
| CPU utilization | Traffic by interface | Application launches |
| Memory free | Packet errors | Application launch time |
| Disk activity | Bandwidth usage | Automatic services stopped |
| Disk space usage | Queue length | |
| Handles usage | Connection activity | |
| GPU utilization | Current connections | |
| Top processes | Retransmissions | |
| Uptime | ||
| User Sessions | User Experience | Browser Activity |
| Total logon time | User input delay | CPU by browser |
| Breakup of logon time | Local network latency | Memory usage by browser |
| Logon duration | ISP latency | Active URLs used |
| Idle time | Internet latency | |
| Active time | Wi-Fi strength |
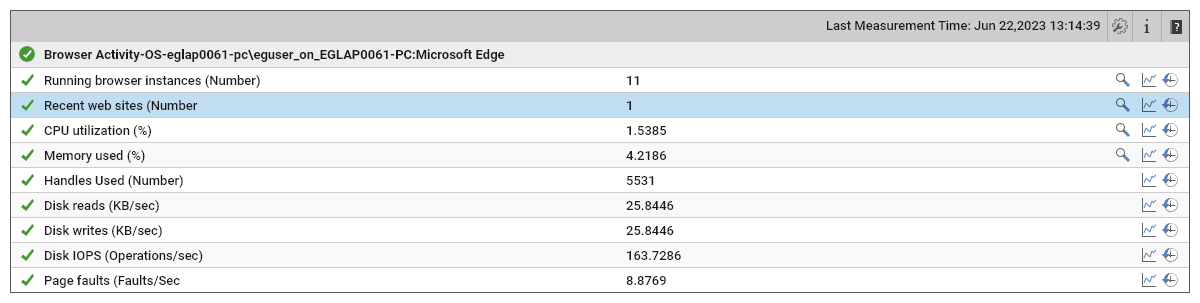
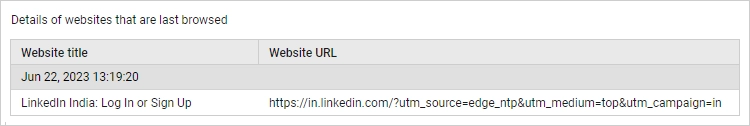
Browser Activity Monitoring and Troubleshooting for Physical Desktops
Many remote workers using laptops and PCs make heavy use of browsers often to access core SaaS apps such as Zoom, O365, Salesforce and so on. Sometimes, browser issues manifest themselves in a very similar manner to internet issues, users report jerky applications, apps freezing, can’t view or access certain websites or services. Users are probably calling into the helpdesk with vague symptoms like “it’s slow”, or “it’s glitching out”.
eG Enterprise allows administrators to examine browser usage, browsers in use (Chrome, Edge, Firefox), browser version and sites accessed. Administrators can easily understand if problems affect one user, a particular browser or a particular website.
User Experience Dashboard for Physical Desktop Endpoints
For every user, a user experience dashboard is available out-of-the-box. This is particularly useful for staff tasked with delivering frontline support to offsite or homeworking employees. It’s a valuable way to see how the session is going – eG Enterprise shows a history of alerts for the user, logon times, network details, resource usage and more.
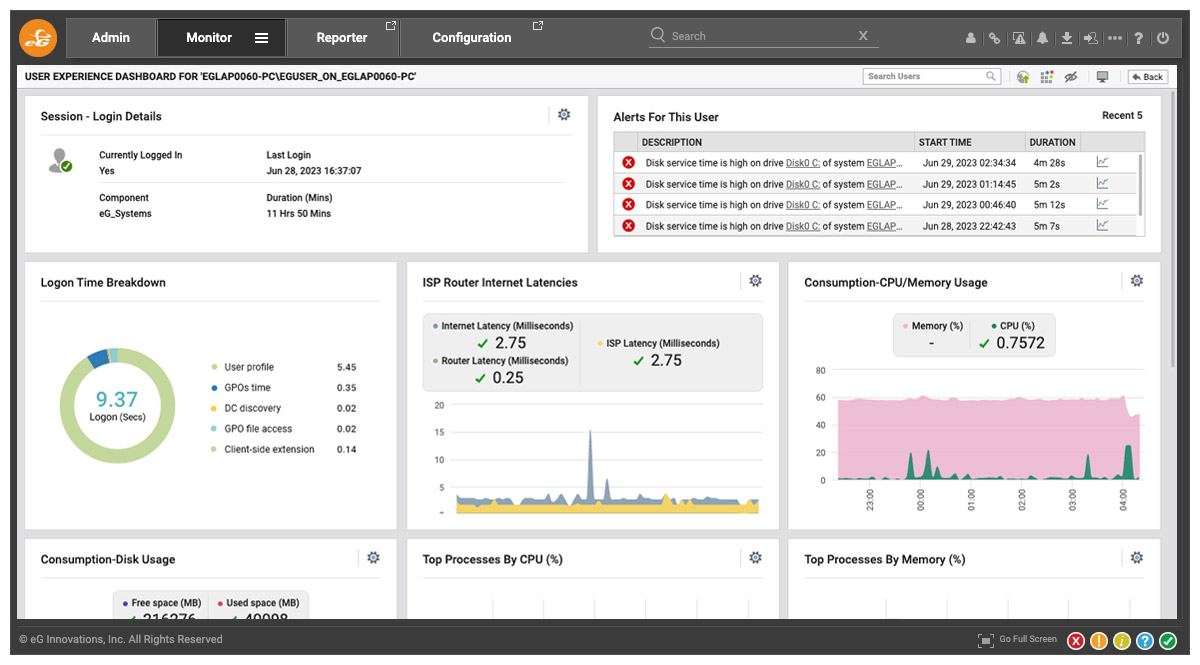
Details of ISP and internet latencies and resource consumption data are particularly useful for staff helping users troubleshoot laptops and PCs being used remotely in work from home / remotely scenarios.
This dashboard can be published out, providing a URL, so that teammates can share the view and start analyzing issues.

How does eG Enterprise monitor Physical Desktops?
The eG Enterprise light-weight agent is installed on each desktop and is configured to push metrics periodically to a remote agent. Administrators can group physical desktops based on department, site, geography, etc, and they are grouped by the remote agent.
There must be network connectivity between the desktop and the remote agent- this could be direct traffic over the local network or internet, or if preferred via a VPN solution. The agent on the desktop pushes metrics to the remote agent, which in turn forwards this to the eG Enterprise manager.
The remote agent does not initiate any communication with the eG Enterprise agent on the individual physical desktop. By design the remote agent has no knowledge of the Physical Desktop Group on which the physical desktops are operating.
eG Enterprise is an Observability solution for Modern IT. Monitor digital workspaces,
web applications, SaaS services, cloud and containers from a single pane of glass.
eG Enterprise is an Observability solution for Modern IT. Monitor digital workspaces,
web applications, SaaS services, cloud and containers from a single pane of glass.
Learn more
- You can read about more of the latest and new features for eG Enterprise in: Observability for Modern IT with eG Enterprise v7.2 | White Paper (eginnovations.com)