Quickly Triage Complex Server and IT Problems
 One of the most common and yet difficult things for any admin to accomplish is to troubleshoot end user response time issues. Application, database, network and server unresponsiveness or slow response time negatively affects enterprise performance and end user productivity ten times more often than downtime and can originate from just about anywhere within the enterprise.
Misconfiguration due to human error, missing drivers, intermittent memory faults, network IP cache errors, unbalanced workloads and constrained virtual resources can all be the root-cause of slow-time, or they could just be a resulting symptom, the key to resolving such issues is getting to the root-cause quickly before they spread to other systems and bring productivity to a standstill.
In the following walkthrough, I detail how such a scenario can be resolved quickly and easily before end users notice with the help of eG Enterprise. This example focuses primarily on Citrix and VMware but eG Enterprise can help IT departments maintain maximum productivity for millions of combinations of enterprise components.
A 100% Web-based, Proactive IT Monitoring Tool
eG Enterprise is a 100% web based solution making it possible for anyone in IT from the CIO and IT Managers to admins and helpdesk specialist to proactively monitor their environment anytime, anywhere on any device and reduce slow response time complaints.
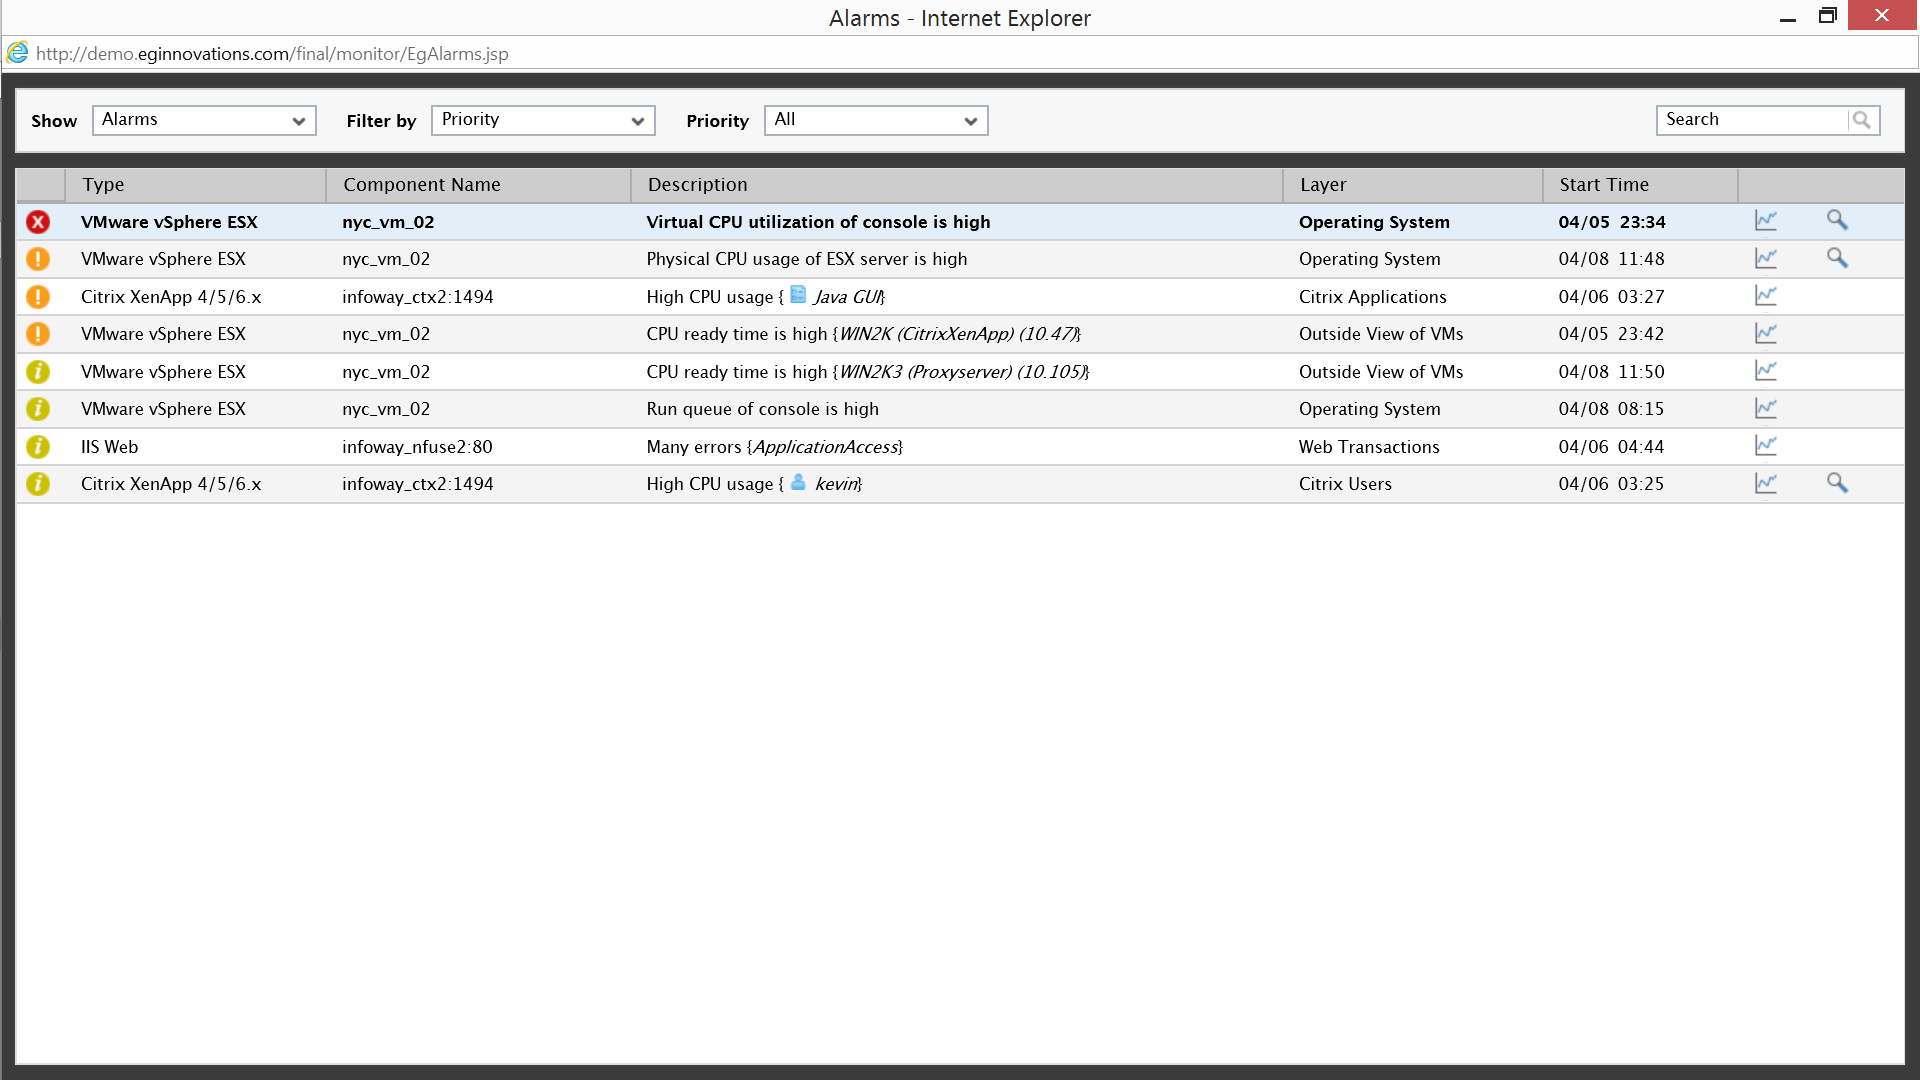
When a slow response time error occurs, eG Enterprise automatically generates an alarm to the appropriate admin so they can take action immediately. The solution correlates and color codes the minor, major and critical alerts and displays them using a layer model with the most critical alert at the top.
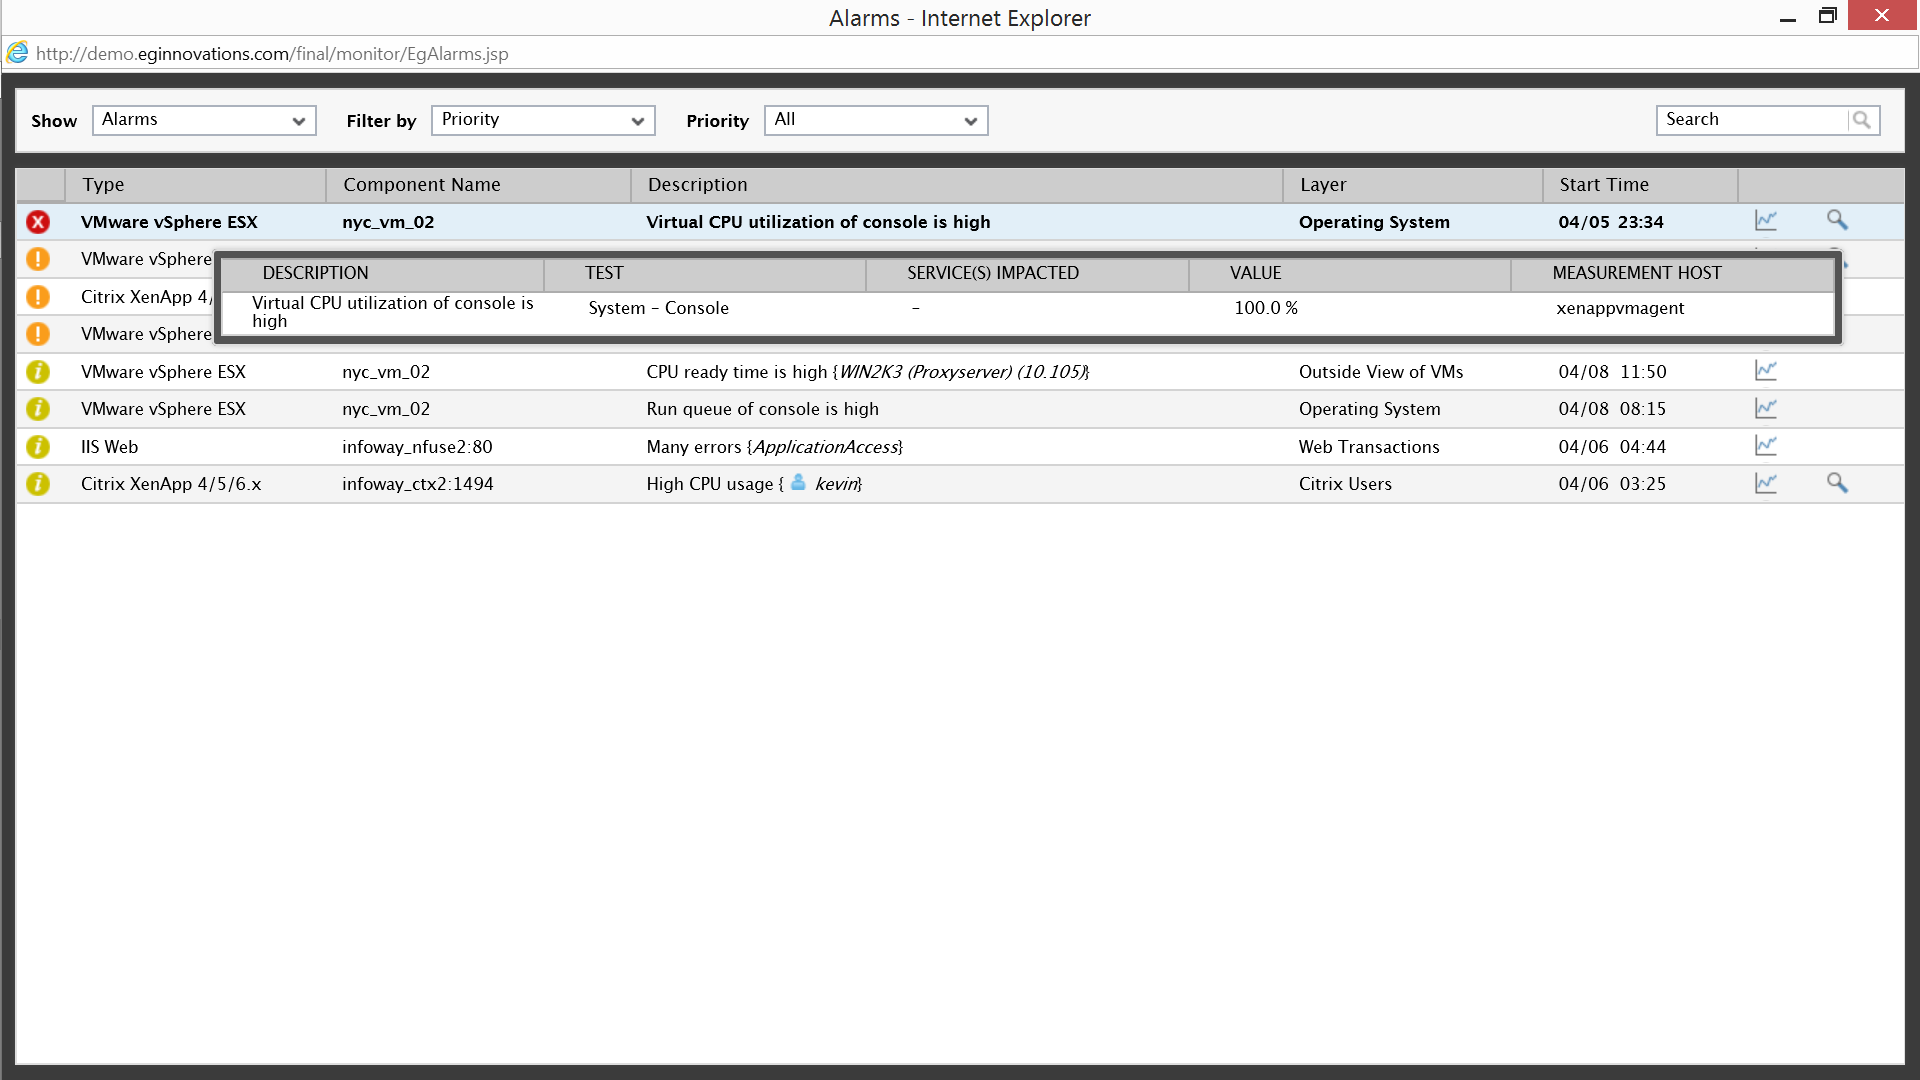
According to the alert Virtual CPU usage in the vmware ESX system console is high. The system console is a bootstrap operating system of ESX and should only be using about 2% of the CPU allocated to it, by scrolling over the description we can see the usage has suddenly increased to 100%; left alone this would surely affect Citrix performance and generate a large number of support calls to IT from end users.
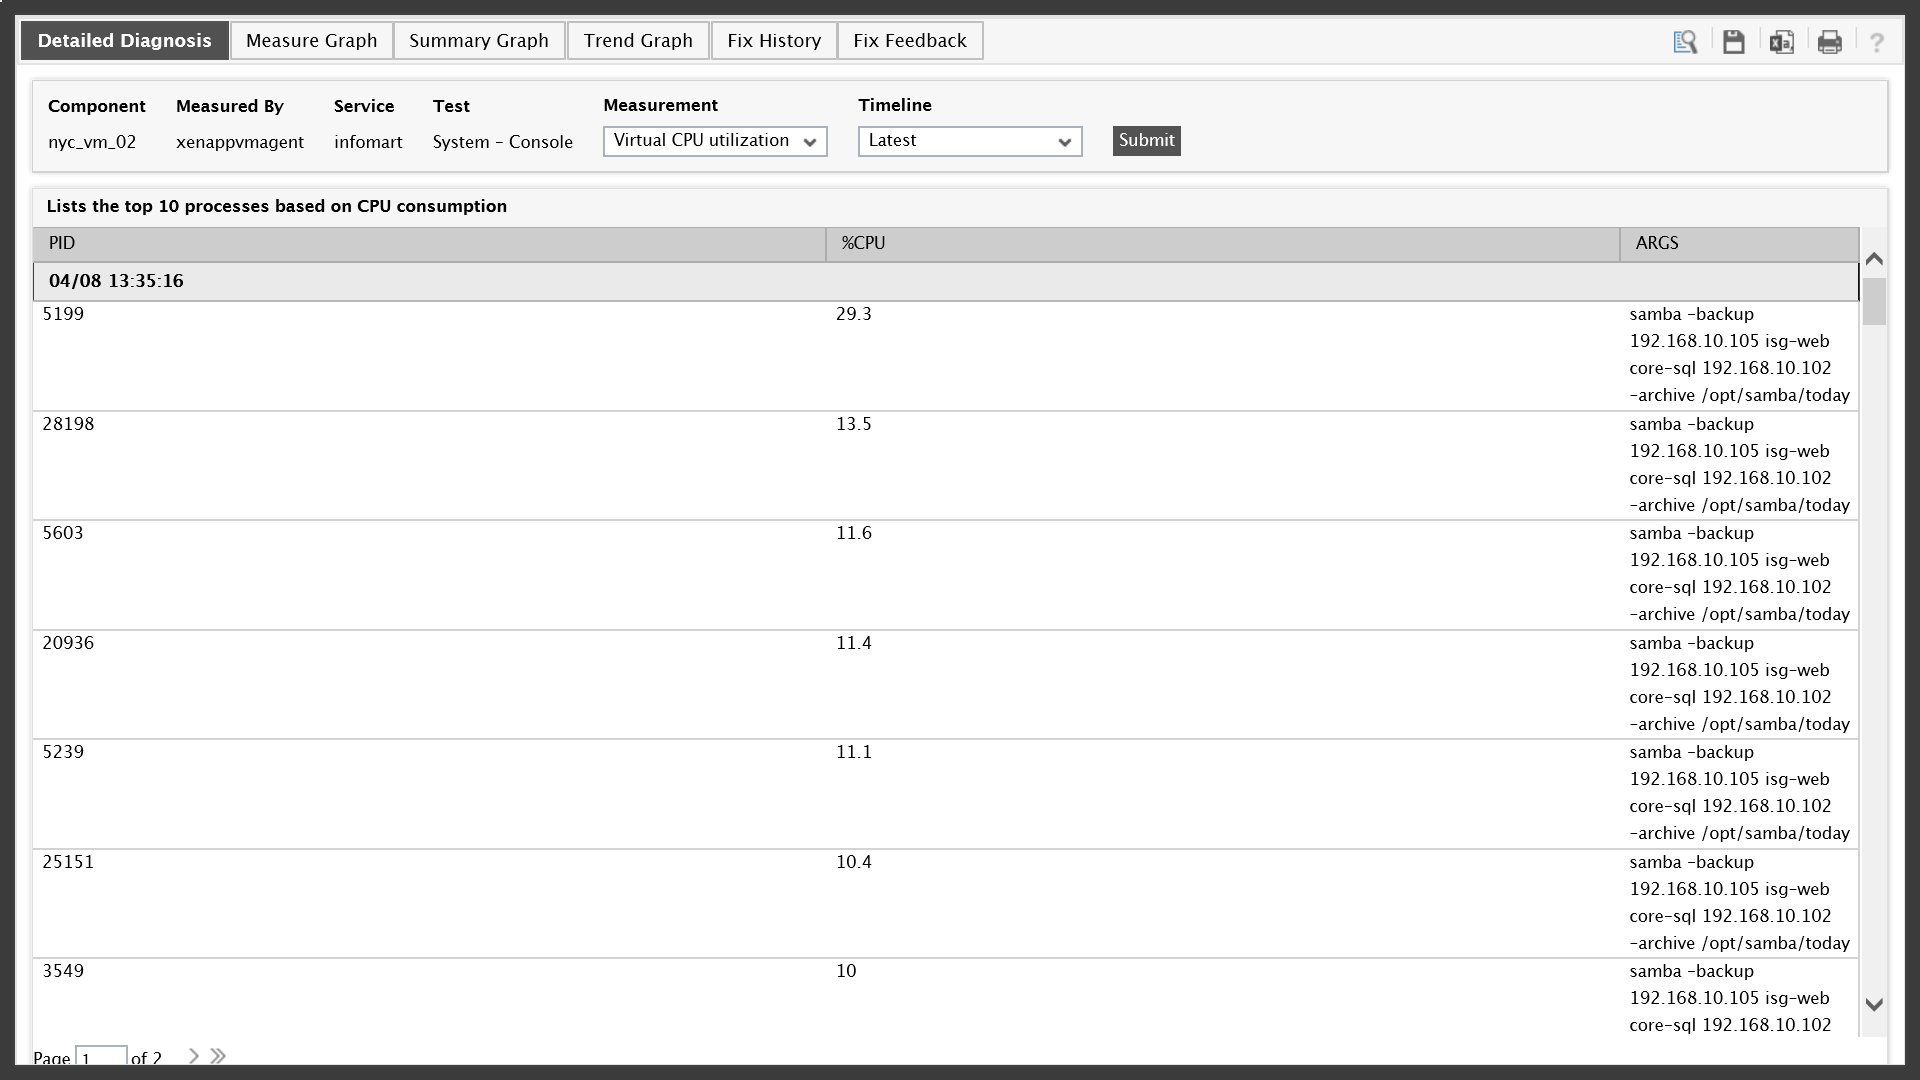
Fortunately, eG Enterprise patented detailed diagnosis technology makes identifying the root-cause a breeze. By scrolling to the right and using the magnifying glass icon, the root-cause is revealed within the Detailed Diagnosis window. The window is displaying information for the top 10 processes using virtual CPU resources; to the right of the window those processes are listed as SAMBA backups.
The root-cause is simply this, the VMware admin is performing a normal backup but it is taking place before the end of the workday potentially affecting Citrix users when they attempt to log on and access applications. The best solution is to contact the VMware admin, explain the situation and either agree to reschedule the backups or adjust virtual resources.
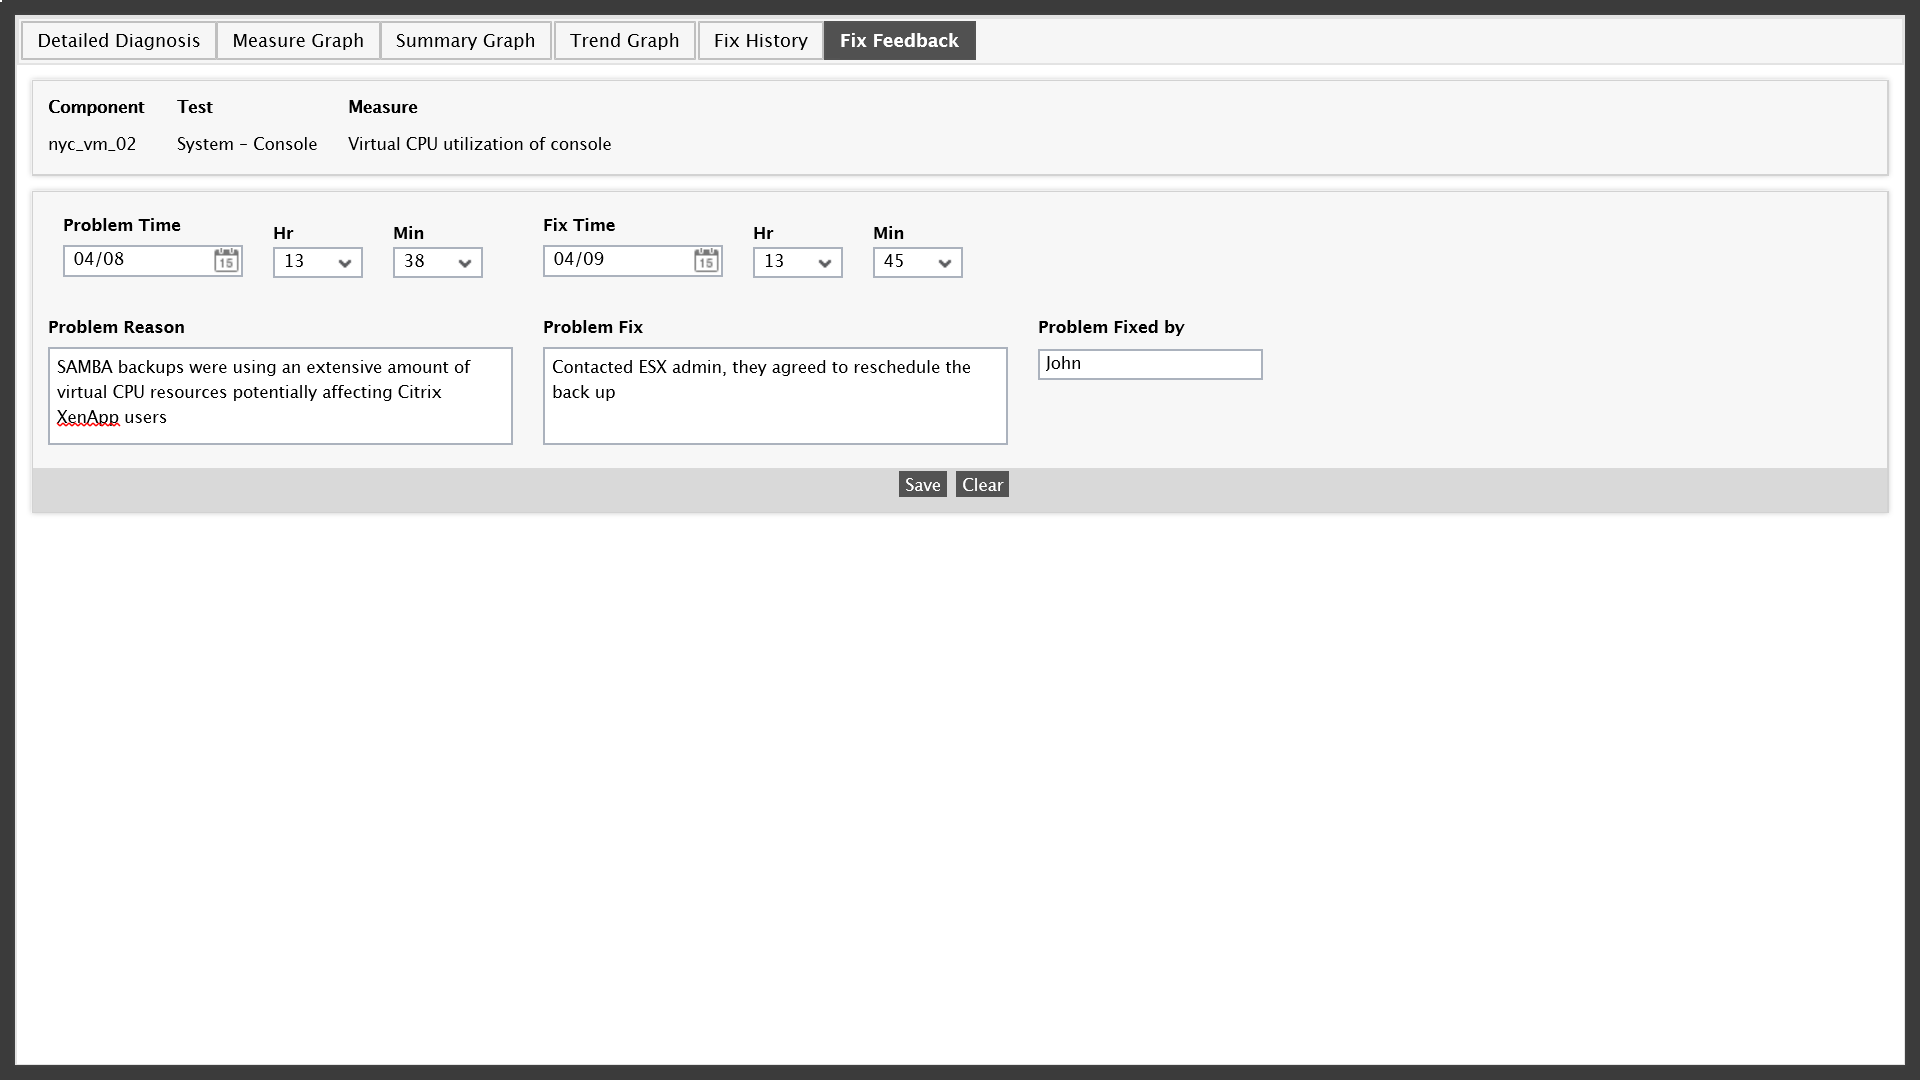
In this case, the Citrix and VMware admin agree to reschedule the backups and then the Citrix admin uses the “Fix Feedback” feature within eG Enterprise to document the event, as well as the agreed solution and save the record. Resolving the issue took just a few clicks and a quick phone call between admins.
eG Enterprise provides universal insight across platforms and domains whether they exist in the Cloud, the data center or in virtual space, it is for this reason that the Citrix admin had the visibility they needed to identify the root-cause as a virtual resource constraint within the vm’s that support Citrix.
The following is a more detailed look at the Citrix admins view of the eG Enterprise Universal Insight dashboard as well as the methodology and technology behind the solution.
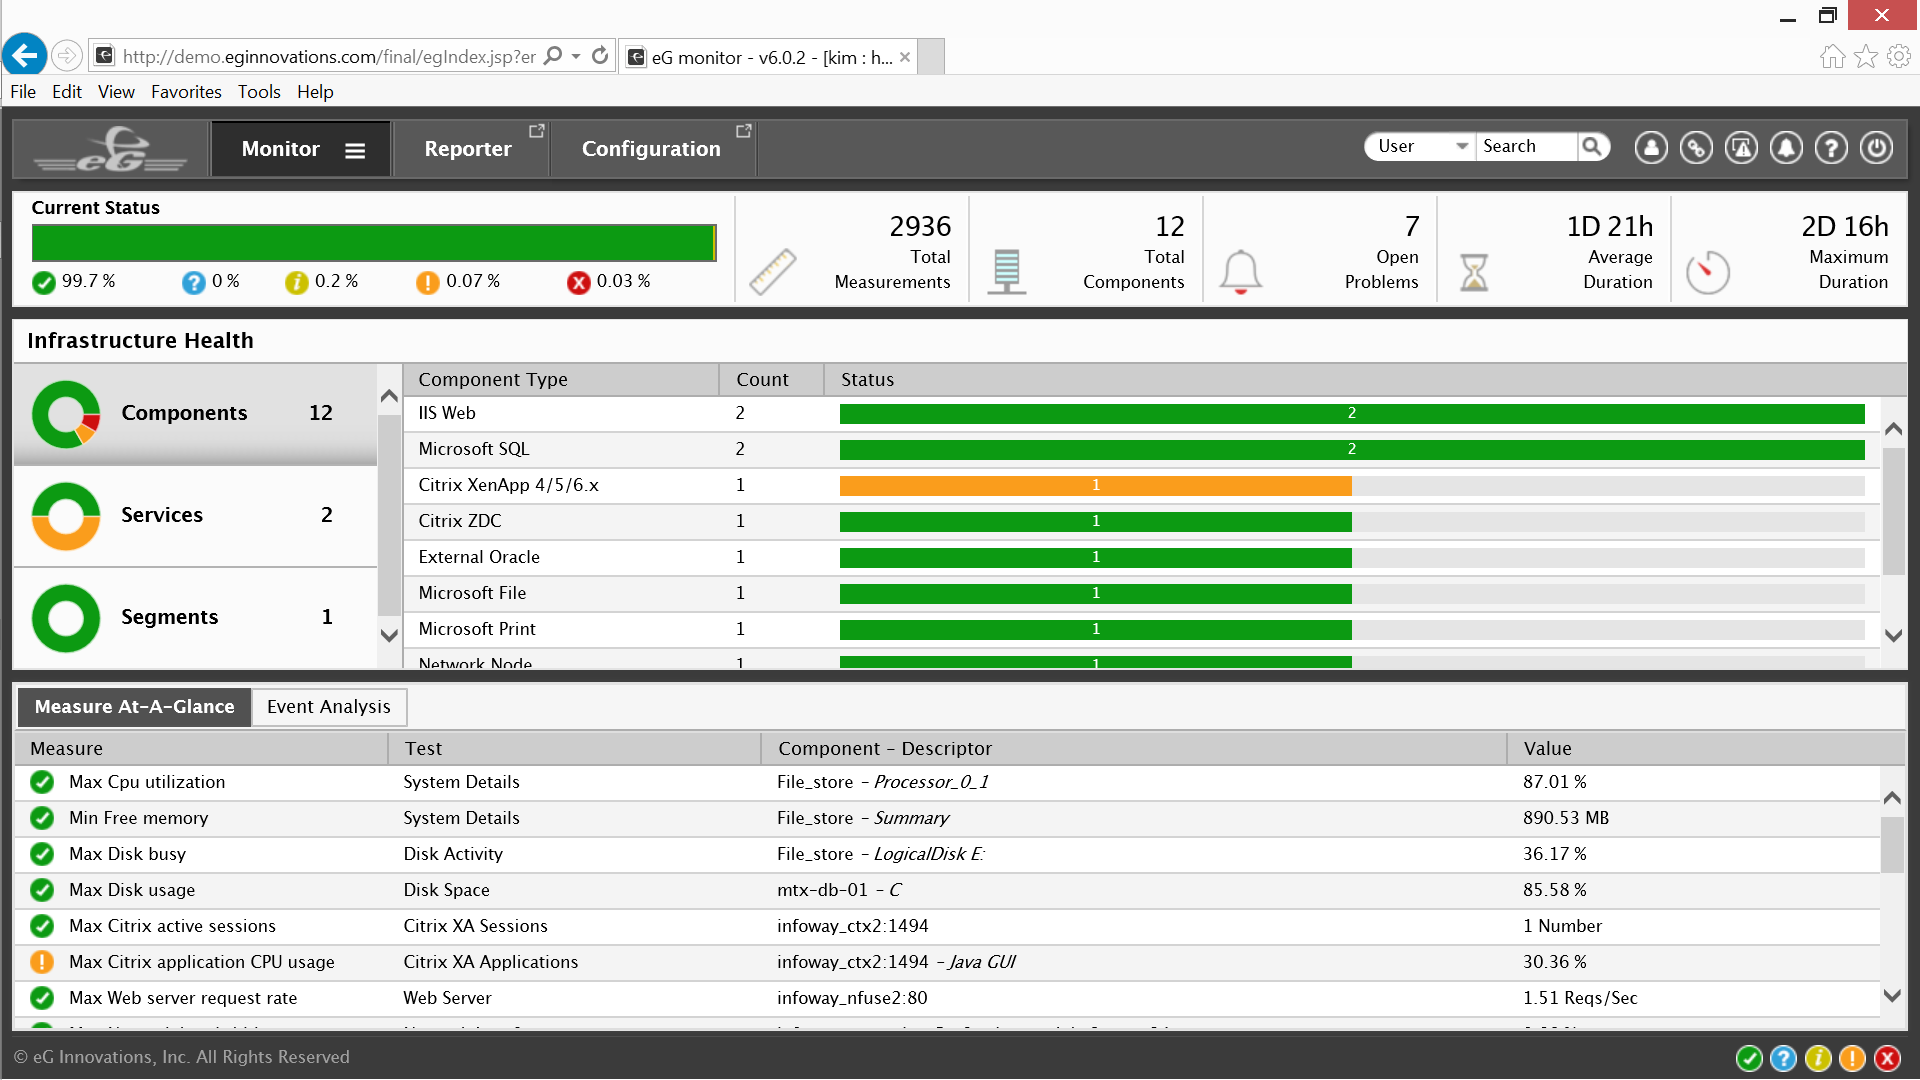
The color codes of eG Enterprise are familiar, green is “Normal”, yellow is a “Minor” alert, orange is a “Major” alert and red is a “Critical” alert requiring immediate attention.
The dashboard provides universal insight for the 12 different components that comprise the two Citrix services they are monitoring. The Component Type panel lists the details for each of the 12 components.
Clicking on the listed services in the middle of the Infrastructure Health panel on the left will reveal which of the two services is generating alerts.
The Measure at – A – Glance panel at the bottom left lists the measurements and tests conducted for each of the 12 components that comprise the two different Citrix service being monitored. Details include CPU utilization, Free memory, Active Citrix sessions, and more.
The bell icon on the top right of the window is a link to the alarm window details viewed previously.
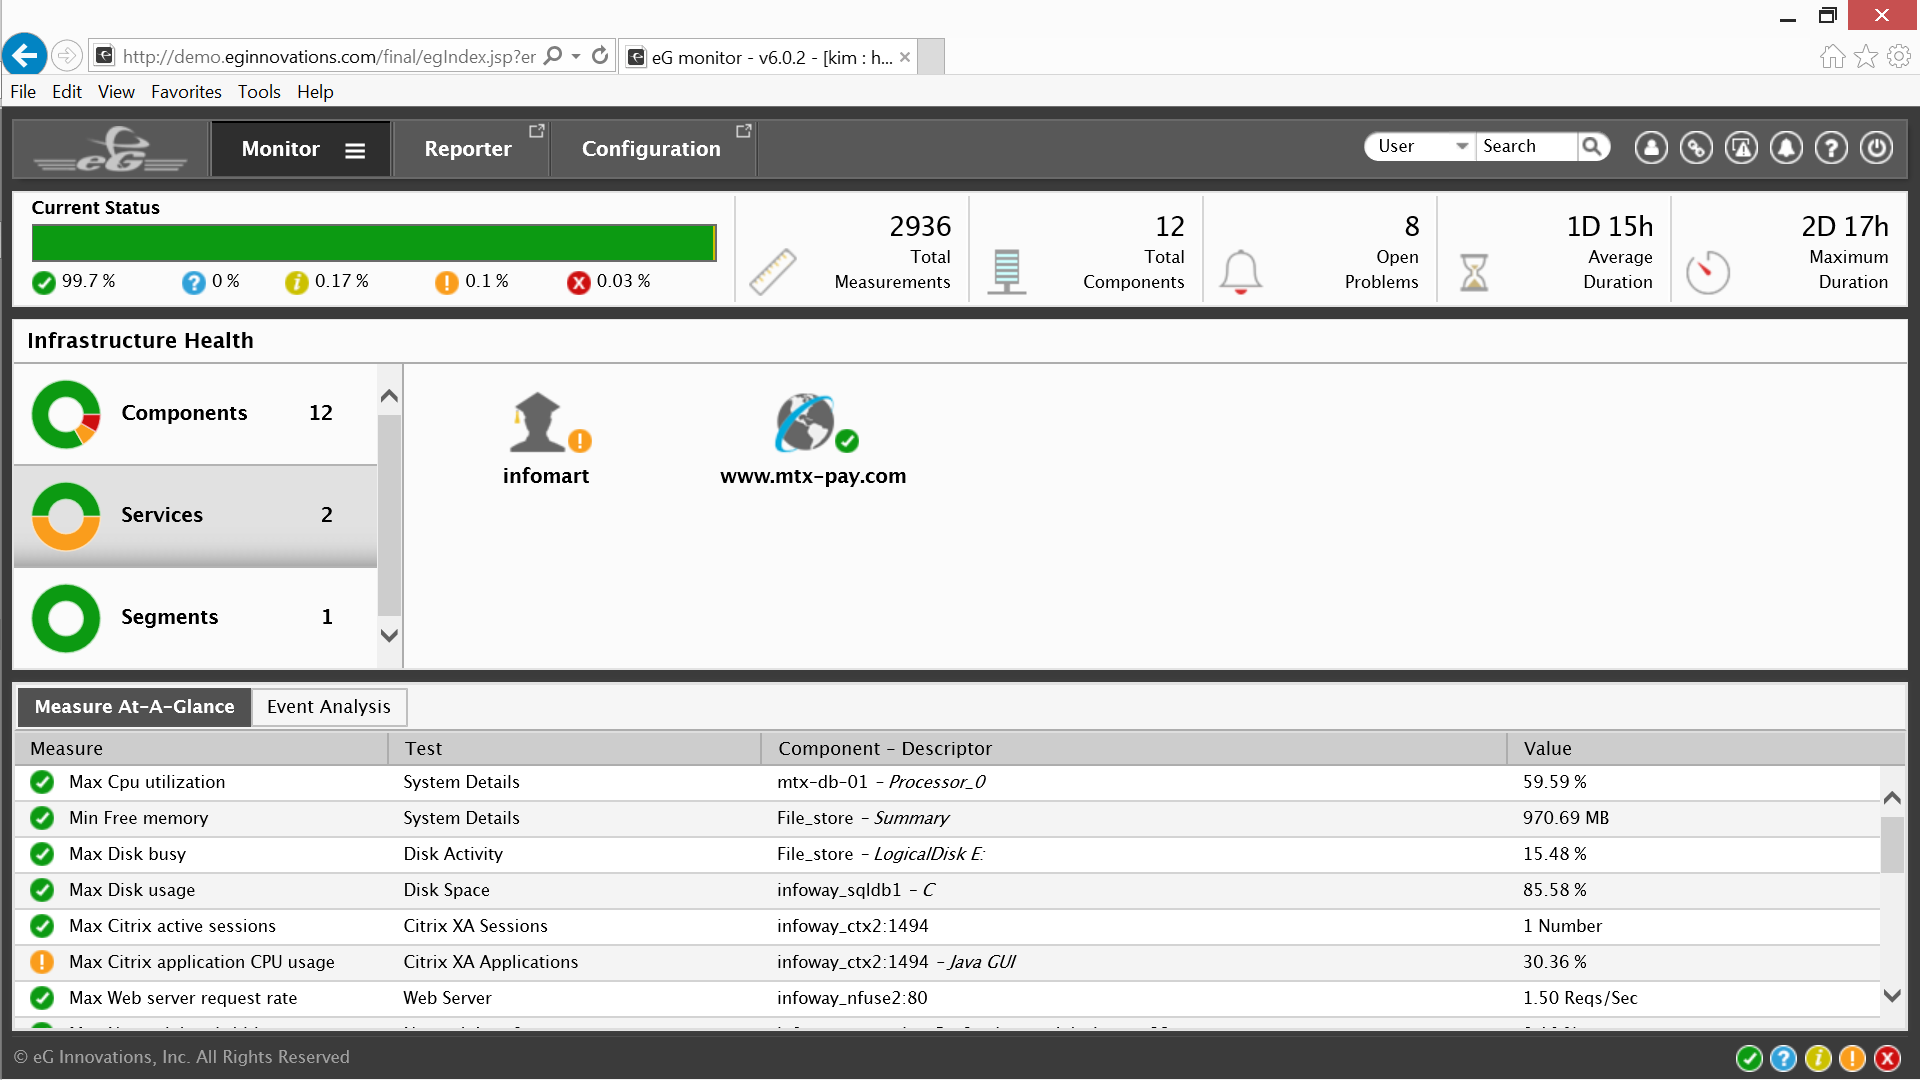
After clicking on the Services panel eG Enterprise presents two Citrix service icons for the different services, it appears that Infomart is the service experiencing major issues, clicking on the Infomart icon opens the list of Web Transactions for the Infomart service.
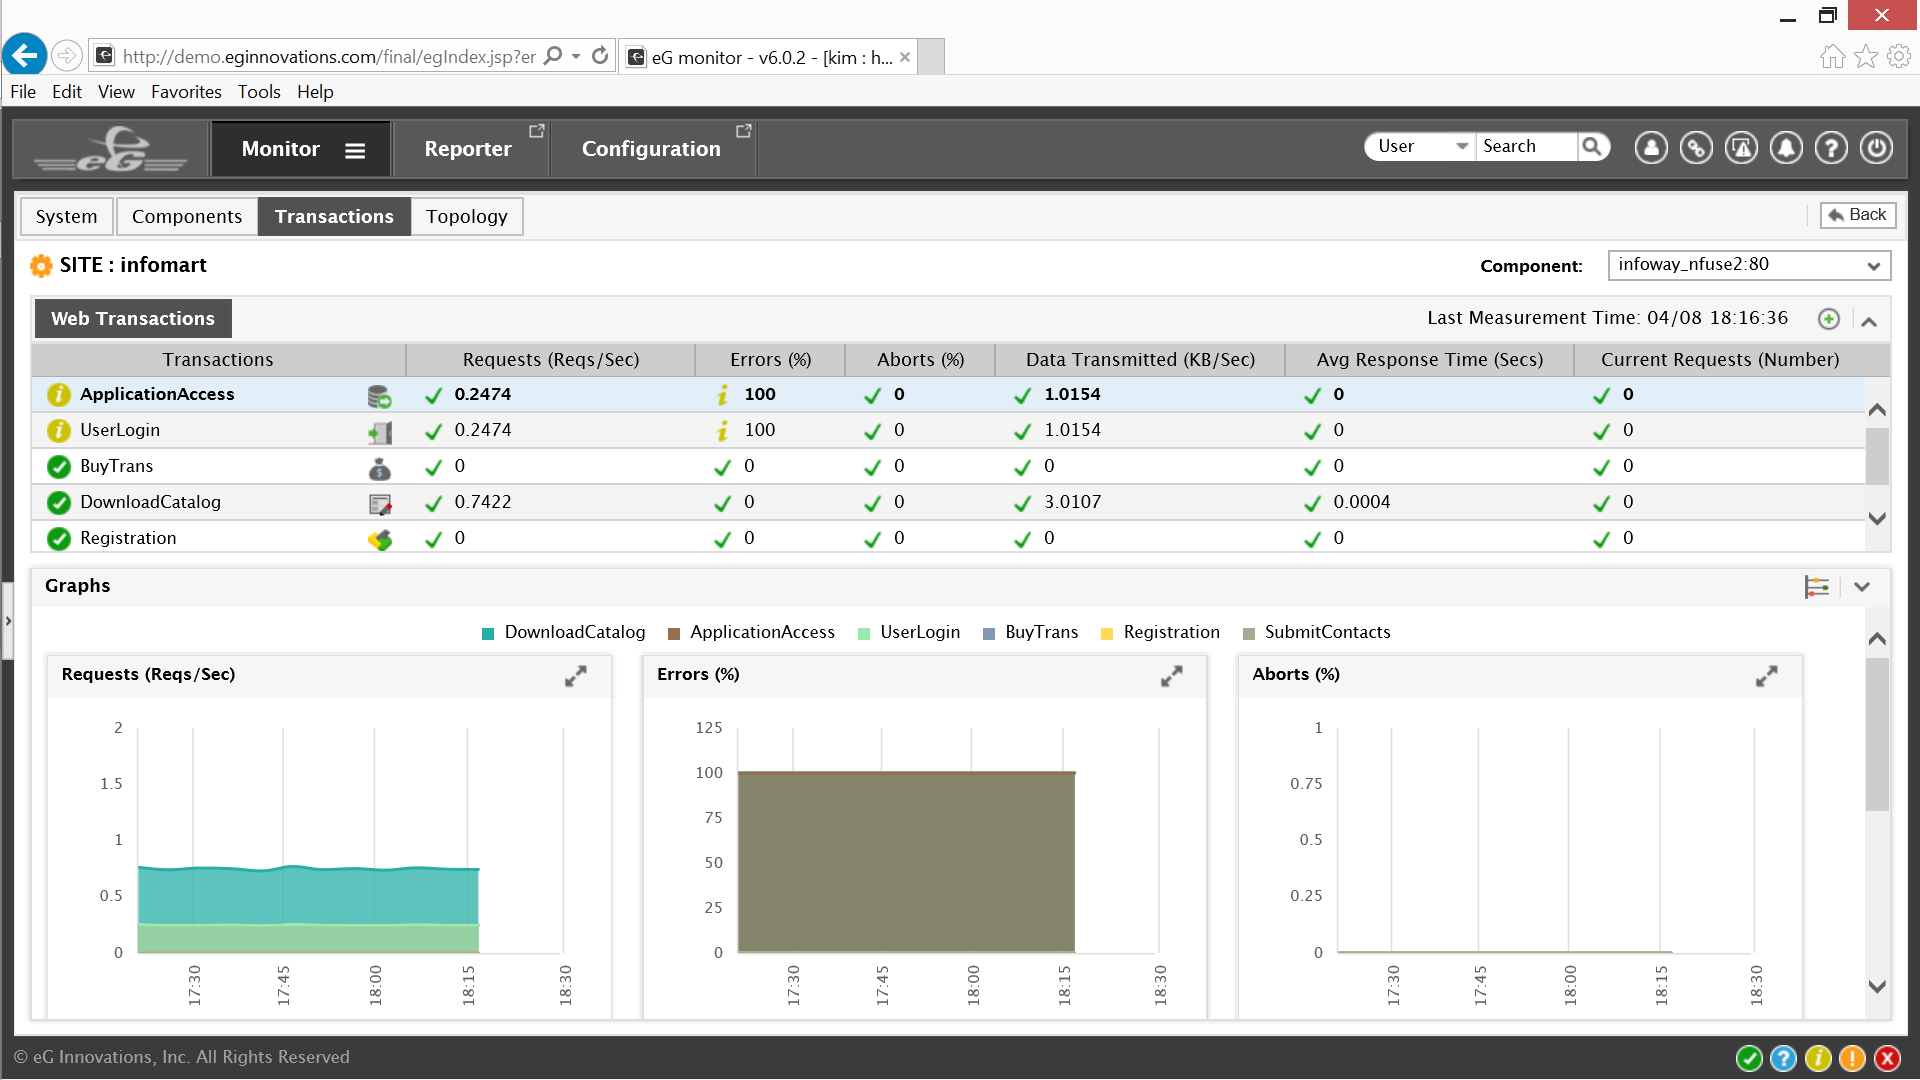
The list indicates that Application Access and User Logons are experiencing errors. The Citrix admin may click on the Topology tab or the transactions themselves for a service topology graph for the Infomart service.
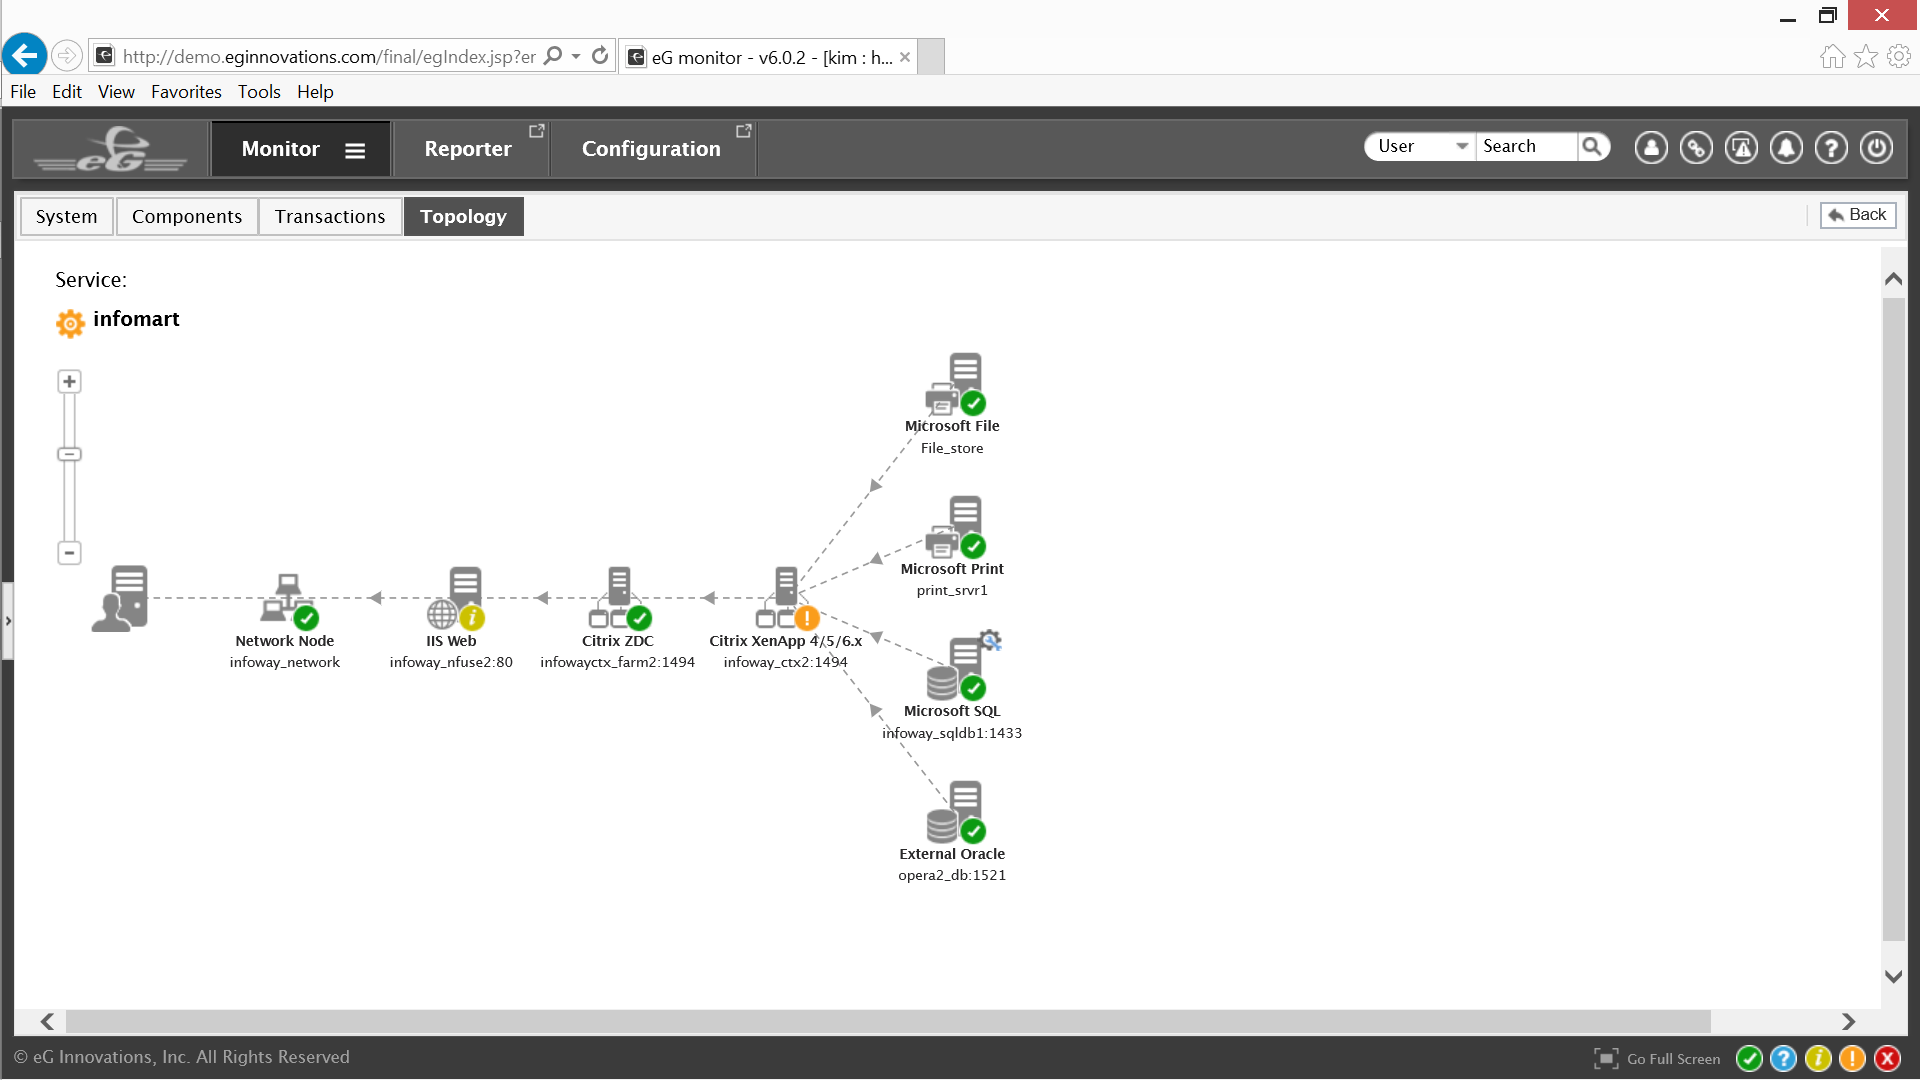
Navigating the Infomart service topology from left to right, end users are connecting to Infomart through a network node, then a web server that is experiencing minor errors; the requests then reach a Citrix Zone Data Collector, which sends the request to one of the Citrix XenApp servers, which is experiencing major errors. The XenApp server then accesses the appropriate file, print or database server on the backend.
Based on the color codes eG Enterprise is indicating that the primary focus should be on the Citrix XenApp servers. Clicking on them will present the Citrix admin with either a physical or a virtual topology for Citrix XenApp depending on the supporting host.
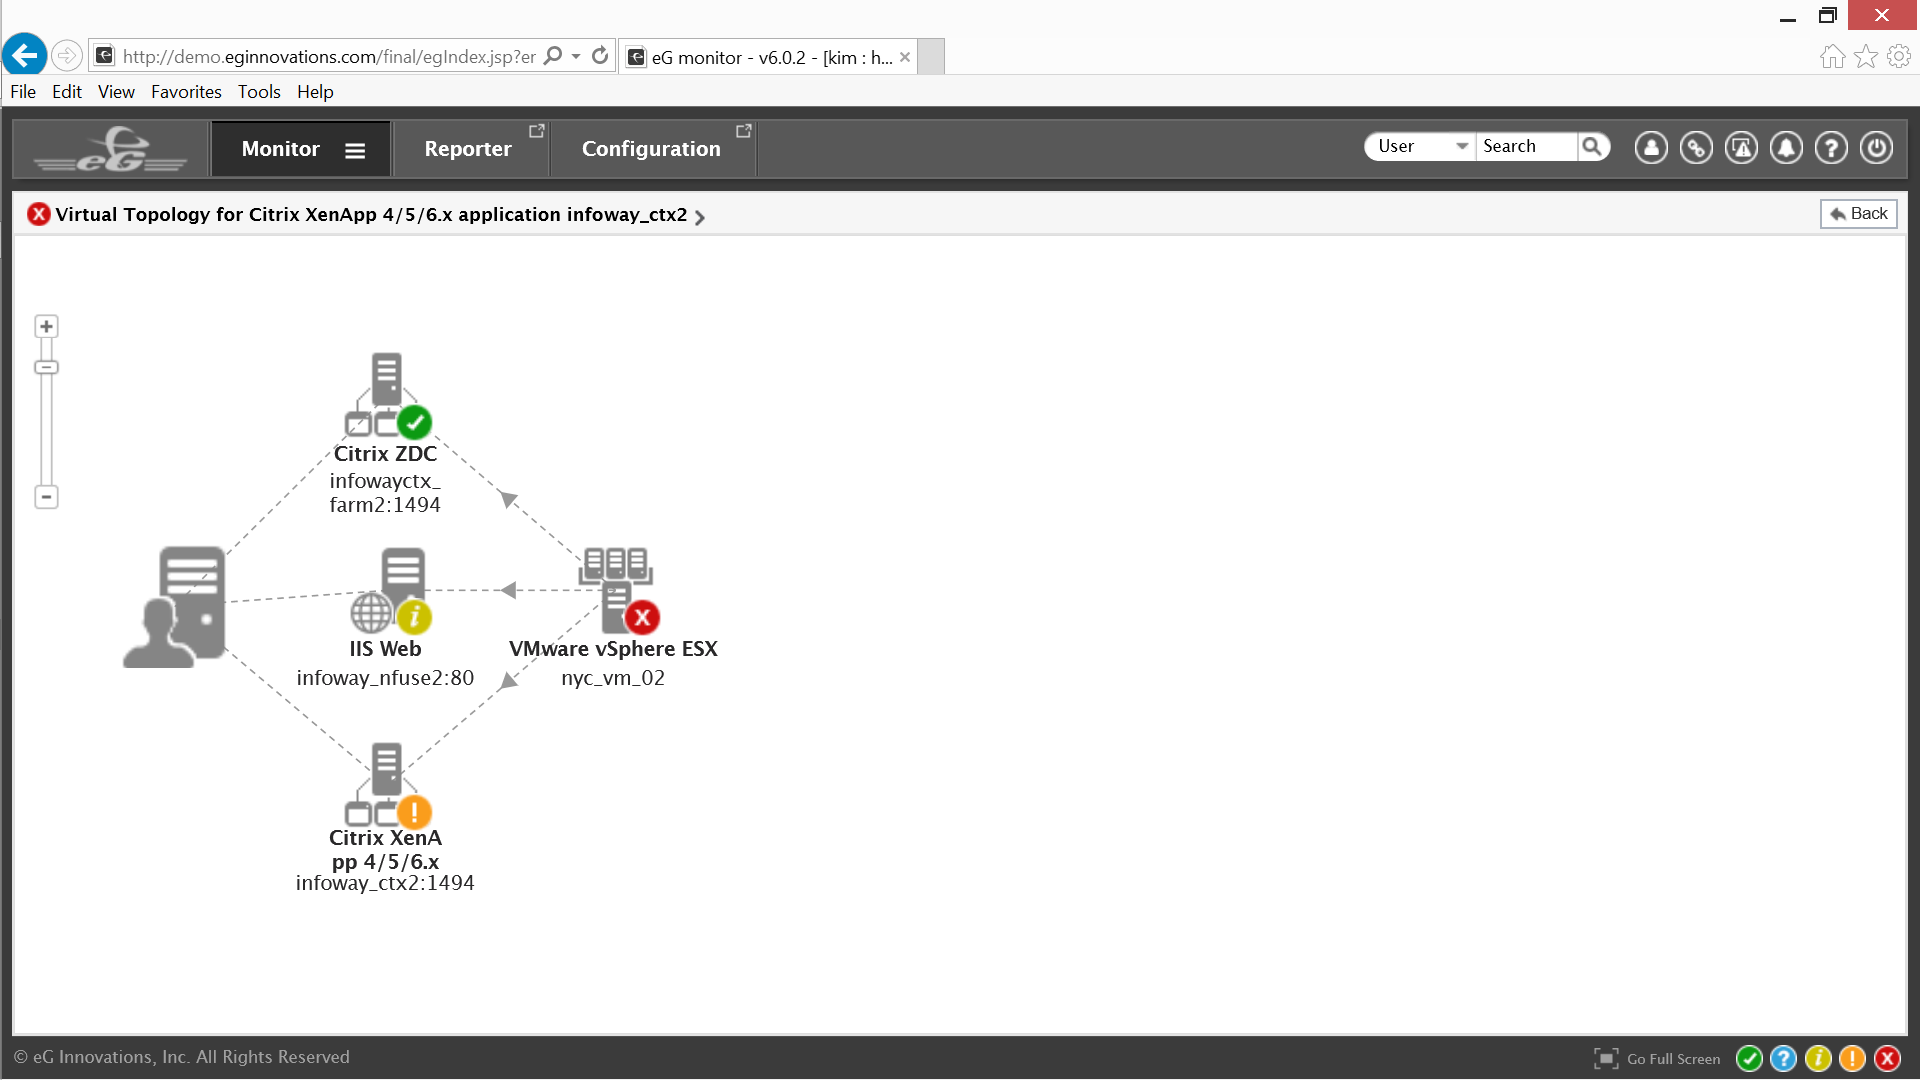
The virtual topology indicates that the VMware ESX virtual machine hosting the Citrix Zone Data Collector, the Web server and Citrix XenApp are experiencing critical errors, that is where the focus needs to be. Clicking on that area of the virtual service topology reveals the elements that support those virtual machines.
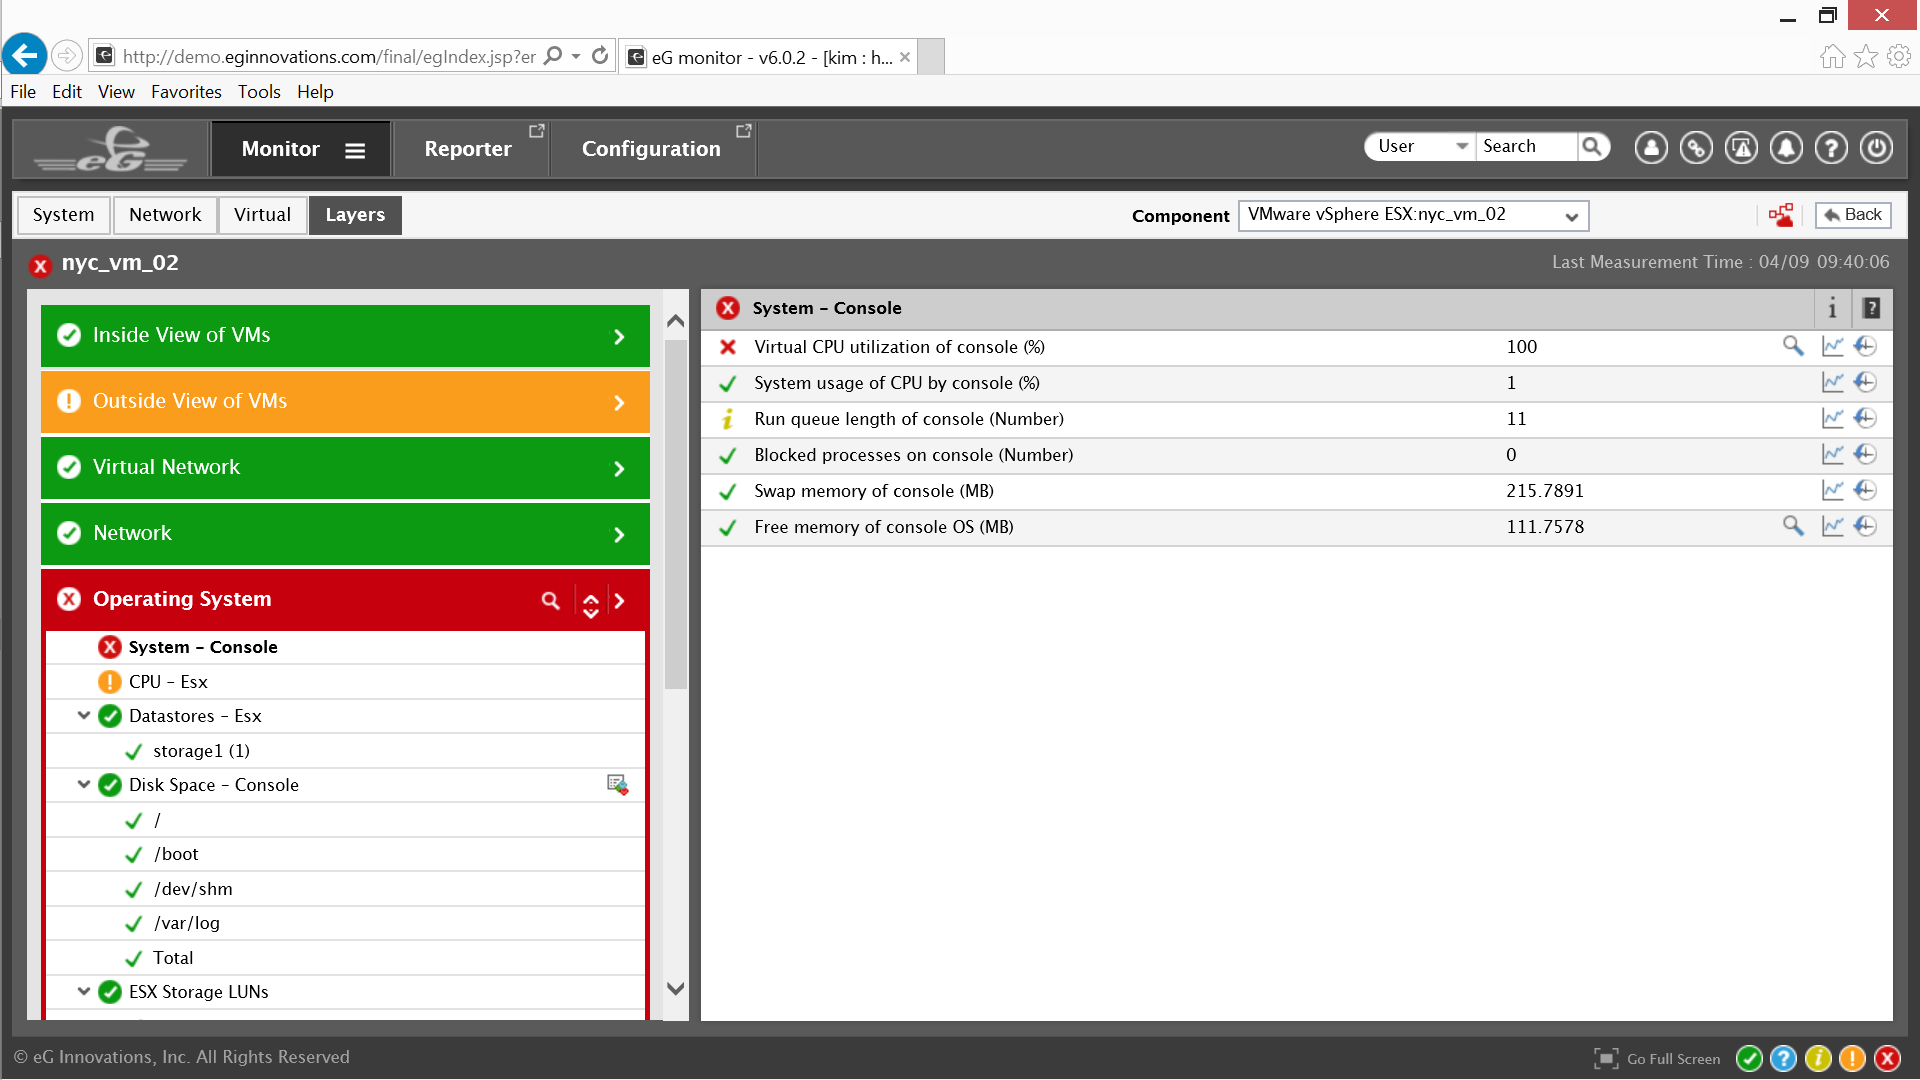
This is the eG Enterprise Layer model for the Citrix XenApp service topology. On the right are all of the elements that support the virtual machines as well as the various tests that correspond to that layer. As an example within the OS layer for the virtual hypervisor are measurements and tests for the System Console, CPU, Disk Space and more; depending on which layer is selected the information within the right panel changes accordingly.
eG Enterprise has already identified that virtual CPU resources within the system console are constrained. Using the magnifying glass icon on the far right opens the same Detailed Diagnosis window previously accessed from the Alarms window and the same SAMBA errors are viewable, this confirms the previous diagnosis.
Regardless of the path an admin chooses to use, identifying the root-cause of a complex IT problem like slow response time takes just a few clicks with the eG Enterprise.
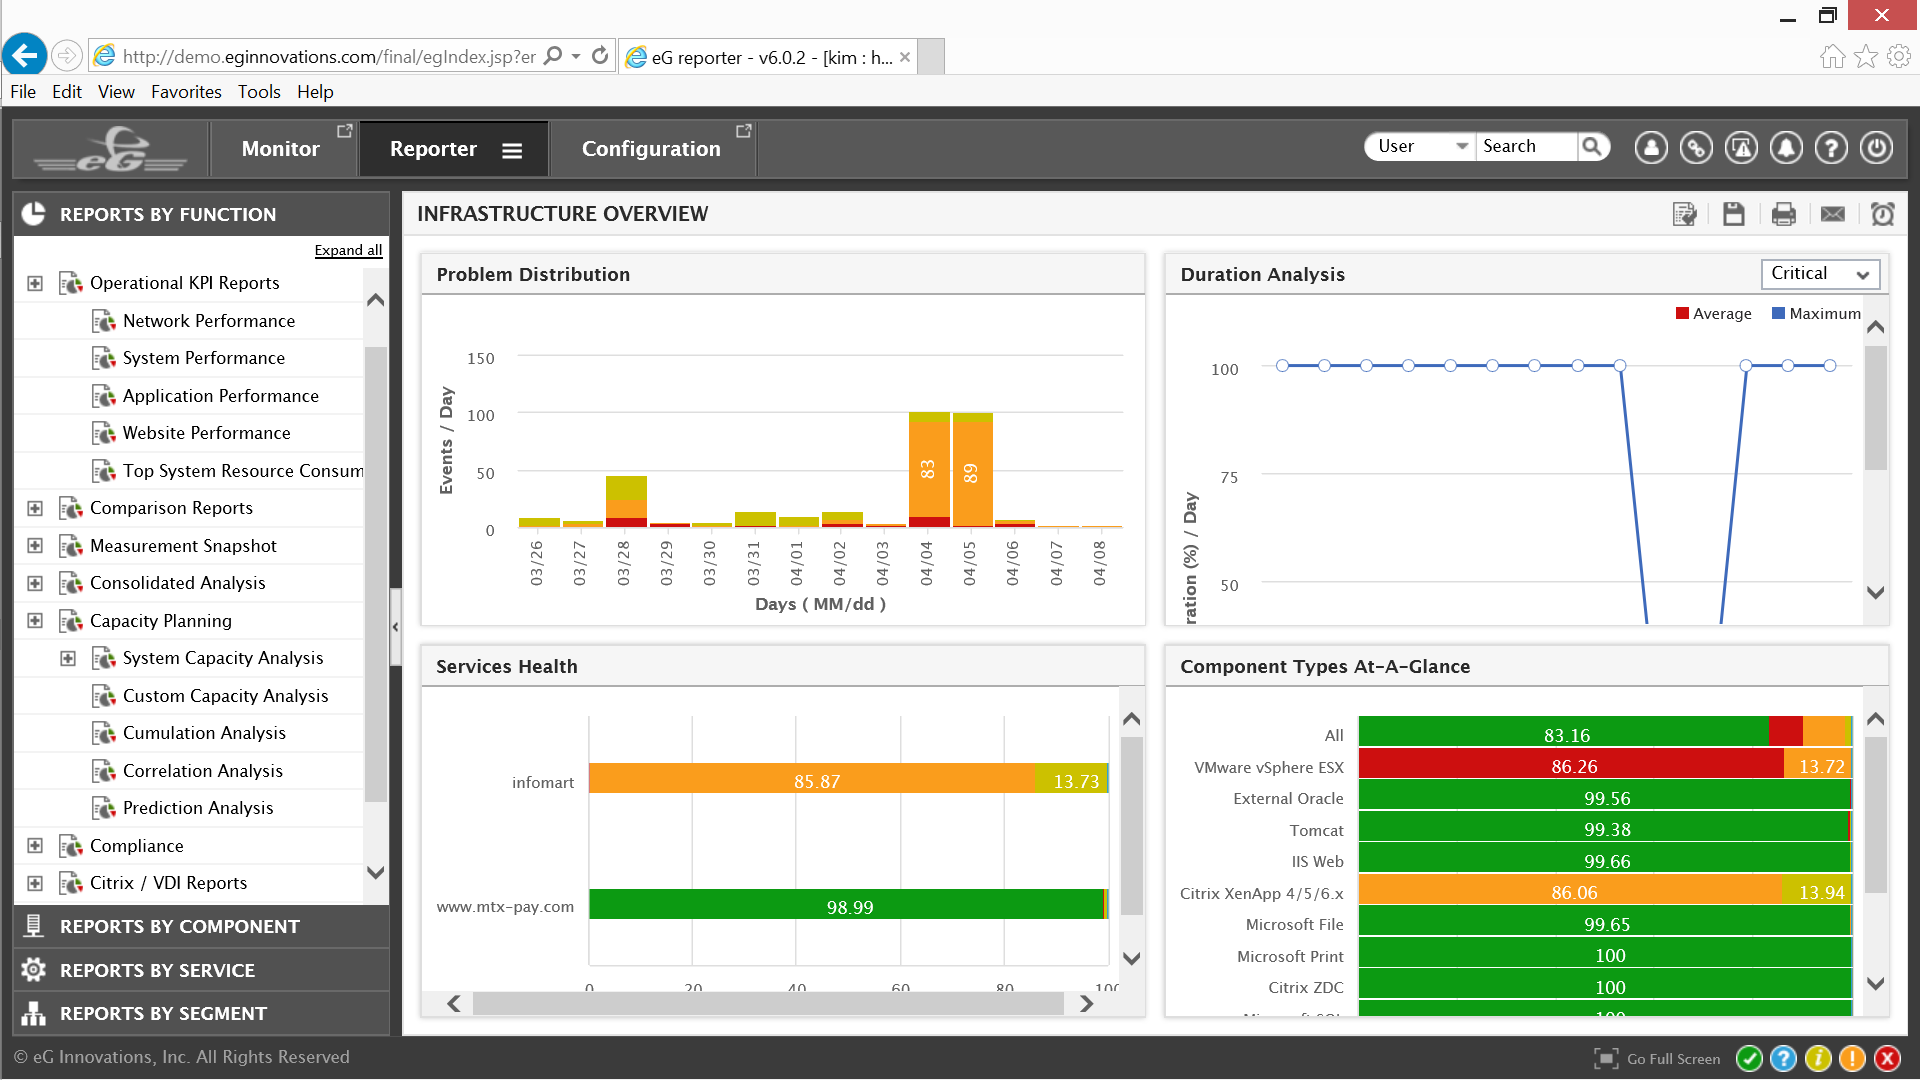
The last thing I will cover are some of the reporting benefits that eG Enterprise provides. By returning to the Universal Insight dashboard and selecting the Reporter tab, anyone in IT can pull performance reports for the infrastructure.
Reports are available based on Function, Component, Service, or Segment; two of the more important are Operational KPI and Capacity Planning. Easy access to comprehensive reporting make it possible to maintain business continuity, predict peak needs, ensure future readiness for emerging technologies while keeping costs down and increasing productivity.
The eG Enterprise methodology is simple, the technology is powerful and the universal insight is comprehensive.
For a free trial, to schedule a live demo or obtain more information about eG Enterprise send a request to info@eginnovations.com or go to our website at www.eginnovations.com
eG Enterprise is an Observability solution for Modern IT. Monitor digital workspaces,
web applications, SaaS services, cloud and containers from a single pane of glass.