In this guide we’re going to look at the top 8 SharePoint performance metrics that every SharePoint administrator should be monitoring. We’ll also talk a little bit about the tools you can use to monitor this metrics as efficiently as possible and get proactive alerts when thresholds are breached.
Top Performance Metrics for SharePoint Monitoring and Management
 Microsoft SharePoint is one of the most business-critical services in enterprise IT. SharePoint is widely used by organizations to create websites where information is centrally stored, shared, organized and accessed by users from anywhere, any time and any device. Major use cases of SharePoint include knowledge and content management, intranet, file hosting and collaboration, and so on.
Why SharePoint Monitoring is Critical for the Business?
It is important to monitor SharePoint because any fault, failure or performance glitch in SharePoint operation will directly affect the end user experience and business continuity. Common problems affecting SharePoint performance include slow web pages, high content growth, database connectivity failures, authentication issues, and so on. With real-time access to SharePoint health metrics and KPIs, SharePoint administrators will be able to detect and diagnose anomalies and triage them before they become business-impacting problems. In this blog, we will look at the top 8 metrics that a SharePoint administrator would need to look at to get a holistic picture of their SharePoint Farm and monitor performance.
Top 8 Metrics for SharePoint Performance Monitoring
#1 SharePoint Farm Health
A SharePoint Farm is a group of servers that enable SharePoint services to be delivered to users. A SharePoint Farm typically comprises front-end web servers, application servers for Central Administration, Search, Crawl and other SharePoint functions, and a SQL server backend. A SharePoint Farm could be hosted on-premises or hosted in the cloud. A SharePoint deployment can also have multiple Farms based on geographic distribution of services or requirements from specific services or departments accessing the service. The administrator who is responsible for configuration, maintenance, upgrade and management of the SharePoint Farm needs to track:
#2 SharePoint Sites and Site Collections
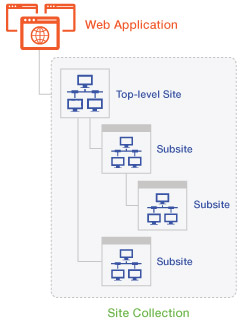 A SharePoint Site is a website containing SharePoint web parts and a Site Collection is a top-level site having a collection of SharePoint Sites. For example, a Site Collection could exist for the sales team of an organization, and under this site collection there could be different sites, such as Inside Sales, Outside Sales, Sales Engineering, Sales Support, and so on. A SharePoint administrator needs to monitor Site availability, which is critical to understand the whether it Site is accessible or down. Additionally, tracking the growth of Sites and Site Collections, most and least active Sites and Site Collections, etc. is important to keep a check on what Sites are getting added and how frequently they are getting used.
#3 Web Applications and Web Parts
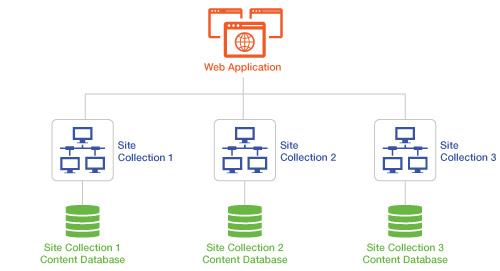
Web applications are the top-level containers for content in a SharePoint Farm. A web application is associated with IIS configuration and consists of a set of access mappings or URLs defined in the SharePoint central management console. These are replicated by SharePoint across every IIS instance. SharePoint admins need to monitor the content growth due to web applications, number of users accessing web applications, content databases used, etc.
#4 SharePoint Documents
#5 SharePoint Databases
SharePoint databases are the repository where all SharePoint documents and files are stored. A web application powered by the IIS server can have one or more content databases. And each content database can be configured to work with more than one Site Collection. Understanding the mapping between the content database, Site Collection and underlying Sites is critical. SharePoint admins need to know which Site is using up more storage in the database, and if there’s a problem in the database, which of its dependent Sites/Site Collections are affected. In addition to monitoring the content database’s disk space usage, one needs to monitor the orphaned items and the recycle bin. A bloated recycle bin can eat up considerable storage when left unchecked.
#6 SharePoint Server
The SharePoint Server is one of the most critical components of the SharePoint Farm as it is central to all services executed by the SharePoint application. A problem in the server could impact almost all operations of SharePoint and affect application availability and performance.
From a server standpoint, it is critical for SharePoint admins to monitor alerts from SharePoint Health Analyzer, which performs automatic checks for potential configuration, performance, and usage problems in the server Farm. SharePoint allows admins to customize rules in Health Analyzer regarding the types of errors to be detected. There are even options for automatic repair. Errors captured by the Health Analyzer are available in reports in the Central Administration user interface. Admins can also use Windows PowerShell to set up email alerts from the Health Analyzer.
Timer jobs are key services in SharePoint. They are recurring processes run in the background on a schedule. A timer job contains a definition of the service to run and specifies how frequently the service is started. Many features in SharePoint Server rely on timer jobs to run services according to a schedule. Depending on the environment, the failure of some timer jobs, such as Outgoing E-mail Alerts, may not pose an immediate problem; but if a timer job responsible for pushing Farm configuration changes out to the SharePoint servers begins to fail, the results could be catastrophic for the Farm if the issue isn’t dealt with immediately.
Diagnostics provided through the Unified Logging Service, aka ULS logs available on the SharePoint server can help in troubleshooting of Farm problems. These logs are text files where each line contains a unique event has a time stamp, the related Farm component, its severity, description of the problem and other useful information relevant to the event. Admins can use PowerShell to filter the logs and export it to Excel. There is also a ULS viewer utility from Microsoft that can be used to view the logs. It was designed for SharePoint 2013, but also works for later versions.
#7 SharePoint Request Management
This is the feature in SharePoint that manages incoming requests. By processing the logic rules created by the SharePoint administrators and evaluating them against the incoming user requests, it can determine which machine in the SharePoint Farm should handle the request and what action should be taken to serve the request. Load balancers are typically used to distribute incoming requests and send them to the right machines. For example, when a specific logic is defined for crawling and a specific web front-end server is configured, the Request Management feature can detect a user requesting a search and route that request to the respective front-end server for processing.
From the perspective of Request Management, it is important to track number of connection endpoints and connections, average processing time, current requests, failed requests, throttled requests, unfinished routed requests, and last ping latency.
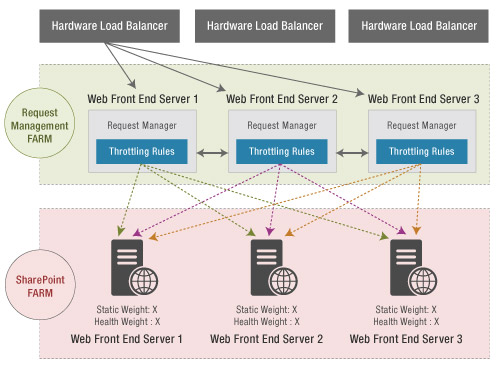
An example of Request Management flow in a SharePoint Farm
#8 User Experience and SharePoint Usage Analytics
As much as it is important to monitor the SharePoint server-side components, it is vital to monitor the user experience of the people accessing SharePoint in real time. By understanding how the user experience is, administrators can easily deduce if there’s any potential problem in the SharePoint application or in the hosting infrastructure.
Because SharePoint is a web-based application, it is important to analyze the reasons for slow web load time. Users may mistake a slow network or browser issue to be a SharePoint problem. Having this clear segmentation of page load time: browser time vs. network time vs. server time vs. content download time is essential for diagnostics. Real user monitoring (RUM) techniques can be employed to monitor user experience of SharePoint users and pinpoint which locations are affected, which users are affected and why.
In addition, SharePoint administrators need to have access to usage analytics to be able to better optimize and load-balance their SharePoint Farm. Analytics must be available to slice and dice the numbers by every user, from every user browser type, for each Site, for each web application, and so on. Key metrics to look for include:
| User Analytics | Page Views | Page Load Time Breakdown |
| Unique users, visitors, destinations, browsers, referrers, Apdex score | How many page views are giving a satisfied, tolerating or frustrated user experience | Average page load time, IIS latency, service call duration, query duration, CPU duration. |
| Page Load Details | Requests | Errors |
| Average CPU megacycles, SQL logical reads, total queries, average data consumed | GET requests, POST requests, OPTIONS requests | 300 responses, 400 errors, 500 errors |
Monitoring all these through manual methods and scripts is no doubt challenging. SharePoint administrators need to look for an automated monitoring tool that can collect and analyze these metrics and help serve as an early warning system to detect issues before they become business-impacting.
eG Enterprise is a holistic SharePoint performance monitoring and management solution that delivers end-to-end visibility into every component of your SharePoint Farm: site collections, sites, web applications, web parts, content growth, databases, SharePoint services, logs, events, and more. Try it for free in your environment and get all the metrics and KPIs you need at your fingertips.
eG Enterprise is an Observability solution for Modern IT. Monitor digital workspaces,
web applications, SaaS services, cloud and containers from a single pane of glass.