Data can be overwhelming. The purpose of this blog is help you sift through data to find exactly what you need to use it in a meaningful way when solving Citrix problems.
After working in performance benchmarking and analysis, one thing I noticed is only the really really big companies have full-time staff dedicated to doing analysis on a daily basis. Which means, it’s up to the generalists, or Jacks and Jills-of-all-trades, to review data and make sense of it. How does one do this?
Here’s the scenario – you have multiple complaints but can’t quite pinpoint it – there’s no ‘smoking gun’. Citrix support is unable to help because of lack of proof that it is a Citrix problem.
Do you just give up? No. If there’s one thing I’ve learned in my 20-year career in IT, it’s persistence when solving Citrix problems.
I’ll show you some easy ways to get data from inside eG Enterprise so that you aren’t wasting time trying to pinpoint any one area causing the problem. It’s probably a collection of problems, kind of like the story of my life. Admins will collect this data and have it ready to send back to Citrix support.
So, even if you aren’t a trained Performance Analyst, keep reading to figure out the next best step using these 5 secrets to solving your Citrix problems.
1. Is it a single user affected or many? Look at end user dashboards and trends
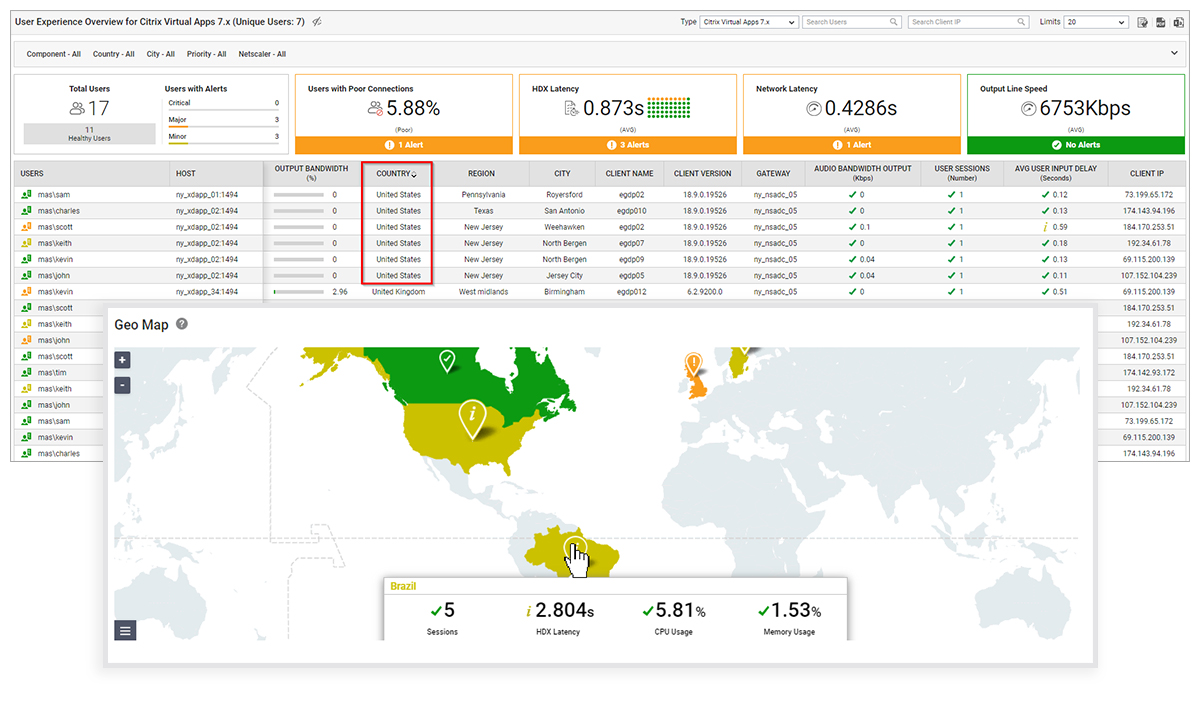
The best way to diagnose a problem is to figure out if it’s affecting all or some users. eG Enterprise’s end user dashboard can help answer questions like: Is it all users in a geographic area? Is it one user?
Inside the User Experience dashboard you can see all connected users and apply filters or even sort by different geographic locations. For example, sort by country to see if any of those users are affected by the issue. This can tell you if it’s possibly affecting everyone in a City, Country on a host. The GeoMap will also help to quickly determine if a region is having issues.
Grab this data by clicking on the top right corner and download as a CSV or PDF. This report is a moment in time that can show possible problems with certain regions. It is data that can be extracted at any time and shared with Citrix support to help figure out the next best step when making changes in the Citrix environment.
2. Blame the network! If Citrix servers are green, then what? Let’s dive into latencies, HDX latencies and User networks. Secret: there’s an Easter egg inside eG
But don’t really blame the network if you don’t have to. The network engineer will not appreciate it.
First, check the overall health of the environment. You can see quickly in a topology map where an issue possibly lies. Below, the only issues are alerting from the VDAs, so that means the infrastructure is all green and good! But it also means there is more to investigate inside the VDAs from a user perspective.
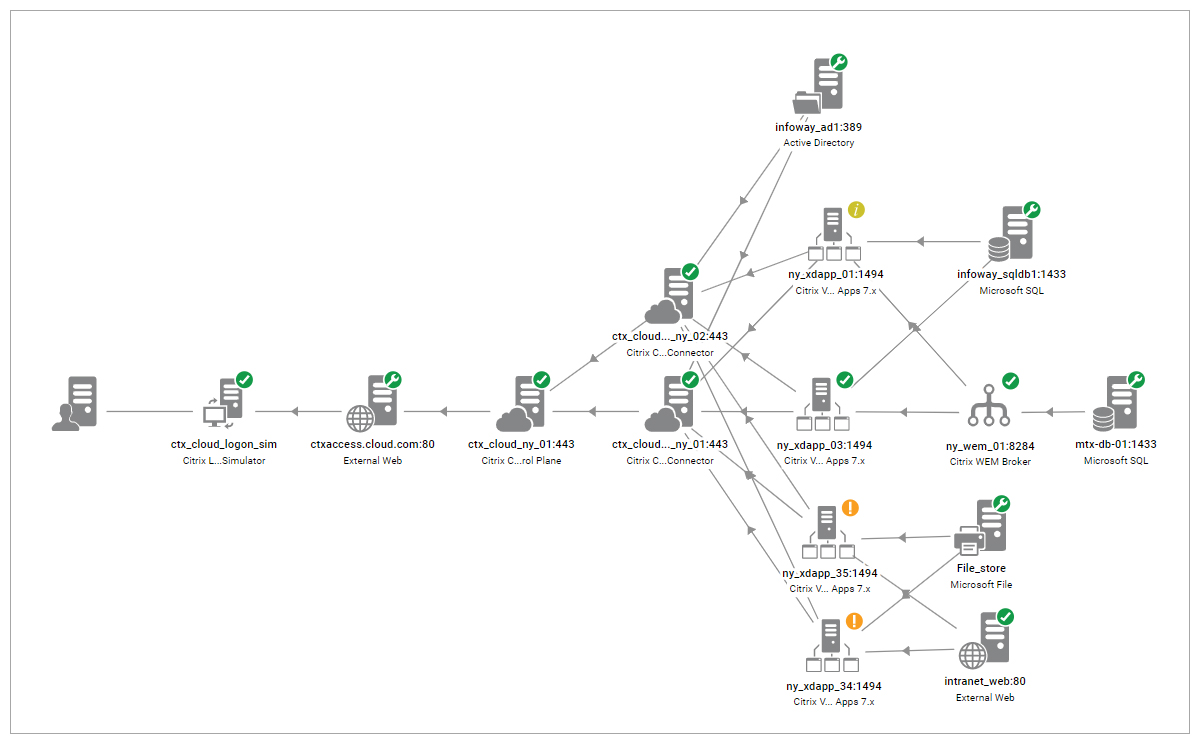
Next, gather the data around user latencies. You might find it’s actually an issue with the user’s network, not yours!
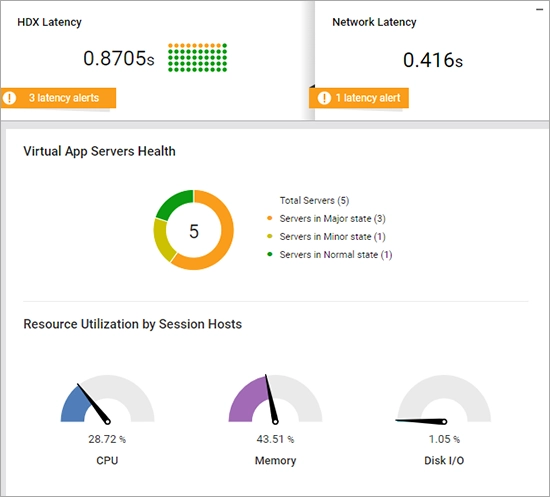
To see the current latencies, first try the Virtual Apps Dashboard Overview. We have an average of .87s across users, but we also see 3 HDX alerts and 1 Network Latency alert.
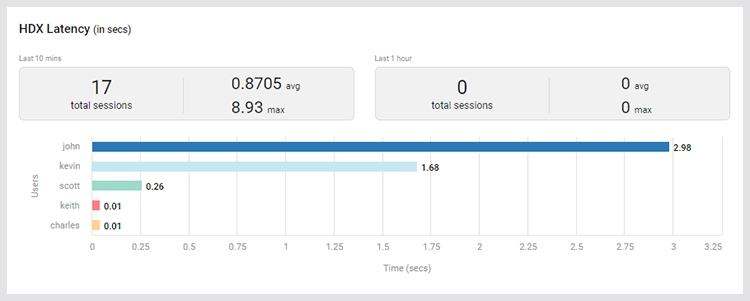
From here, click on the left icon to see more details around User Experience in real time.
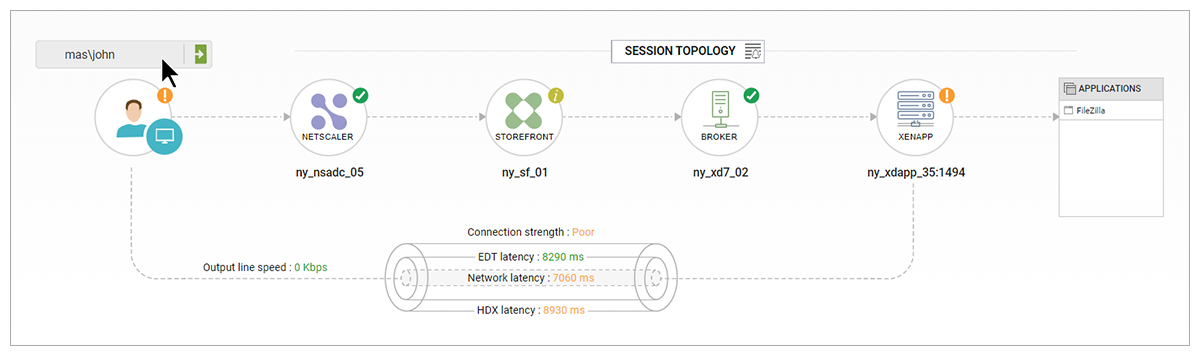
One more deep dive into John’s session and it’s clear that their connection is the problem. In the image below, the Connection Strength is Poor because of the Network Latency, which is round-trip time between the Citrix VDA and the end-user. The HDX / EDT latencies are not adding significant extra latency indicating the Citrix receiver stack and user interaction with it is not likely to be causing the issue.
At this point you will want to determine if the issue is affecting all (or many) users or just a single user. This will help you differentiate between end user issues such as home Wi-fi issues, ISP problems, CPU/RAM resource problems on a home laptop and true networking issues. A data center network issue will affect multiple users. Further investigations can be done in many ways:
- eG Enterprise v7.2 offers a lightweight agent for physical desktop monitoring that allows administrators to get details of the user’s end point including home Wi-Fi, ISP latency and CPU/RAM usage.
- Customers using Citrix ADM and NetScaler will get latency metrics split between user-end latency and data center latency metrics to differentiate. eG Enterprise integrates with Citrix ADM and can show the latency split between user network and data center network latencies.
A secret “Easter egg” inside eG Enterprise. If you are looking for network details inside all the desktops on a host, try this trick:
-
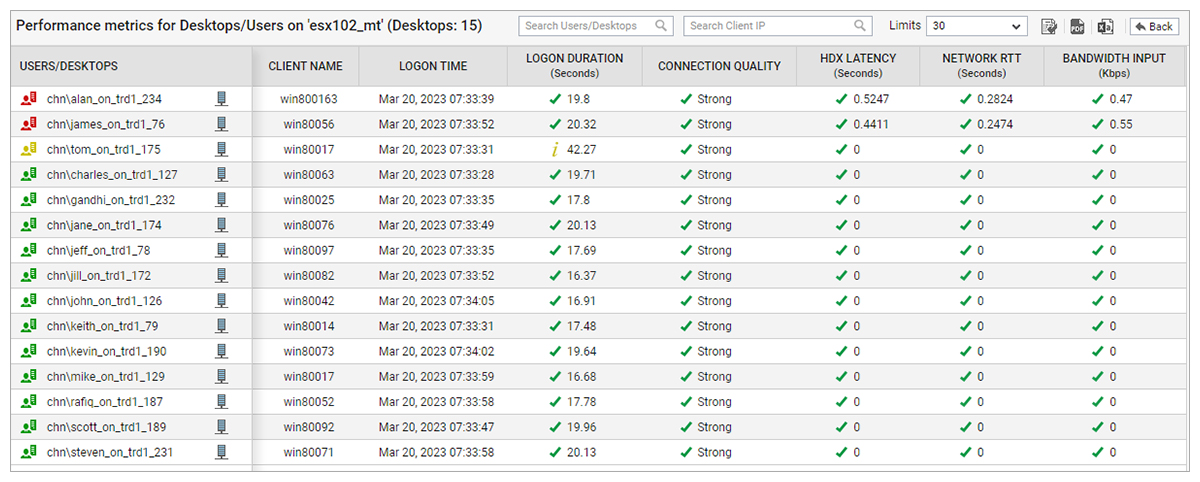
From the VDI host view, click on the word “Desktops ” from the layer “Inside View of Desktops”
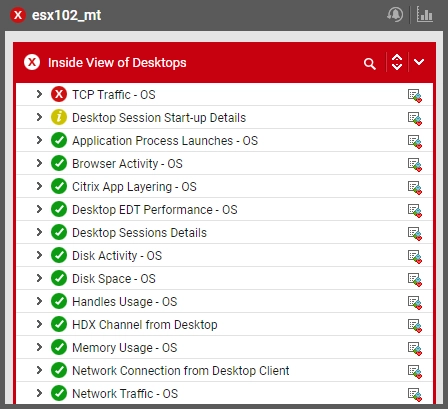 Figure 6: When viewing a VDI host, there’s a top layer called “Inside View of Desktops”. Click on the word ‘Desktops’ for the “Easter egg”.
 - Voila! You see a table of all the desktops sitting on that host with a variety of metrics in one screen. Yet another way to help determine if the issue is occurring for one or many users.
3. Under-provisioning kills servers. Let’s look into resources and where to increase them
Every admin knows that CPU, memory and disk are necessary for Citrix survival. But as you add more users, servers may need to be scaled out.
After eG Enterprise collects about a month’s worth of data, the reports get more and more valuable. Specifically around Capacity Analysis and Prediction. Let’s look at these 2 reports to help determine which servers needs help.
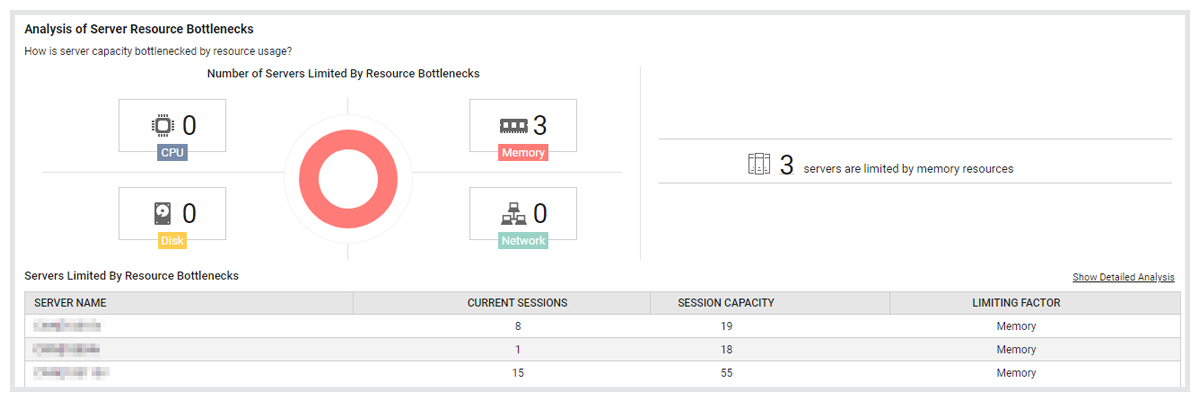
Capacity Analysis for Virtual Applications report is the one that analyzes the current usage and let’s you know what is limiting the growth of user sessions. In the example below, it’s memory. Memory could be part of the bigger issue, so keep this data in case you need to come up with a plan with the Citrix team.
Capacity planning often identifies underused and idle resources too, these can be reallocated to other uses to reduce and optimize costs without compromising performance.
4. What are the consistent errors in your environment? What keeps showing up?
Look for patterns of problems. Getting alerts is one thing with a monitoring system, but getting a report of the alerts is another. This will help you see how frequent alerts are, what types of alert are common, which servers have been having the issue – and for how long problems have existed or reoccurred.
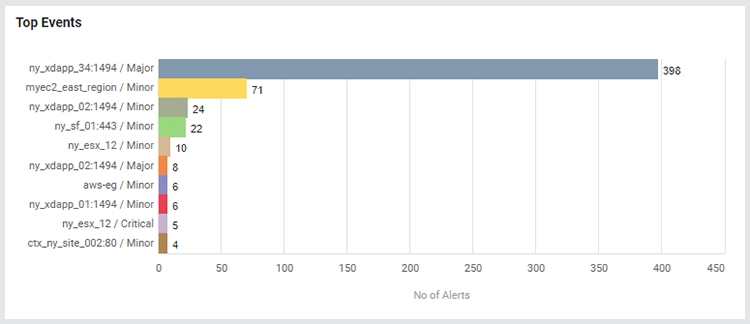
eG Enterprise’s Top Events report is key to understanding where to move to next. This will tell you what the lowest hanging fruit is. Below, it’s the server ny_xdapp_34. Diving in a little deeper into the report – click on the gray bar with 395 issues and see there’s been a trend of issues with the Printer Bandwidth. That’s where to start. Download and save this data in case Citrix support, or management needs proof of the problem.

5. Send yourself reports – admins don’t have to keep looking inside eG Enterprise everyday. Set up a report to go into your inbox
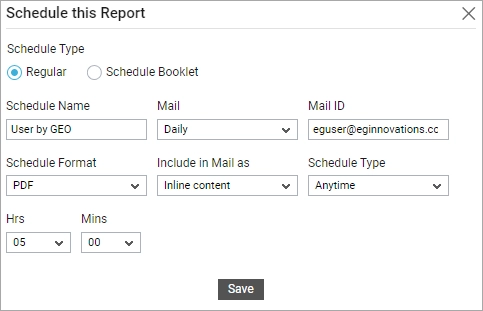
In my opinion the best report with full details around users is the “User Experience by GEO” report. This is a new report in eG Enterprise v7.2, so if you aren’t at that version, reach out to your support team to get upgraded.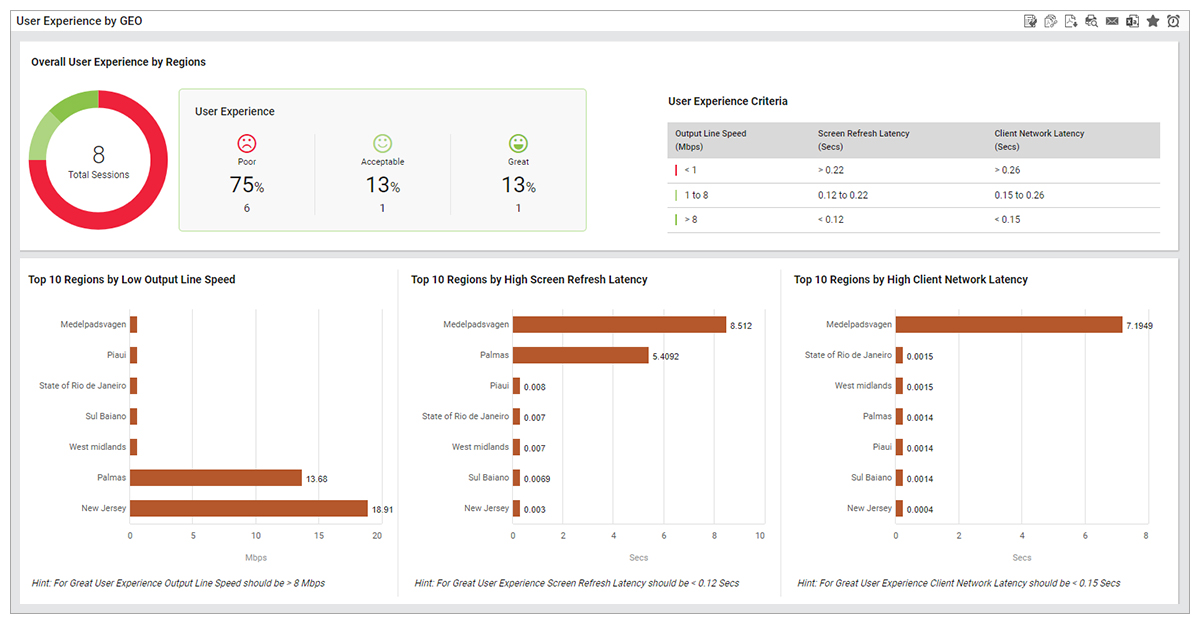
From here, click on the alarm clock icon (in the top right of the tool bar) to schedule this report and email it to yourself on a regular basis: . You can set this up to show up in your inbox before you start your day.
Conclusion/closing comments on solving Citrix problems
When there’s a big problem, it can be hard to figure out the next best step. Sometimes, all you need to is take this data to Citrix Support. eG Enterprise will arm you all the necessary metrics to prove there is an issue with Citrix. Most of this is available inside the reports. Let eG Enterprise’s reporting system do the heavy lifting for you.
You don’t need to be a professional performance expert to get the data you need. It’s the data that will help fix the issue. Solving Citrix problems is easy with the right data!
eG Enterprise is an Observability solution for Modern IT. Monitor digital workspaces,
web applications, SaaS services, cloud and containers from a single pane of glass.
Further information
- Learn more about eG Enterprise observability solutions for Citrix technologies, see: Citrix Monitoring Tools | eG Innovations
- Citrix Workspace and eG Enterprise: Complete performance visibility for Citrix Workspace and Citrix infrastructure (eginnovations.com)
- Find out about other new developments in eG Enterprise version 7.2 in Observability for Modern IT with eG Enterprise v7.2 | White Paper (eginnovations.com)