How does the eG .NET BTM Work?
The eG .NET BTM is currently capable of monitoring transactions to web sites / web applications hosted on an IIS web server only.
To be able to track the live transactions to web sites on an IIS web server, eG Enterprise requires that a special eG .NET Profiler be deployed on that IIS web server.
If more IIS web servers are in the transaction path, then, the profiler will have to be installed on each of the IIS web servers, for end-to-end visibility.
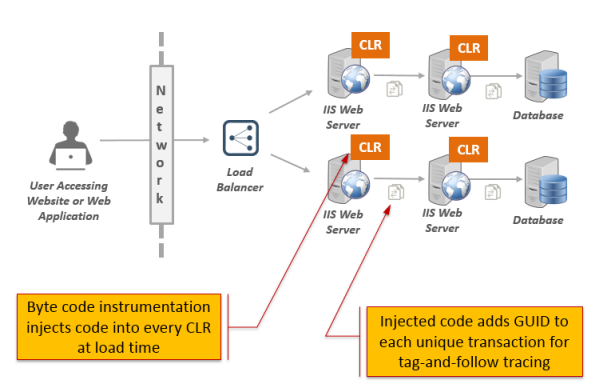
Figure 1 : How eG .NET BTM Works?
Typically, requests to web site transactions are handled by application pools on an IIS web server. Whenever an end-user requests for a transaction, the application pool spawns a worker process (w3wp.exe) to service that transaction request. Upon receipt of a request, the worker process automatically invokes an instance of the .NET CLR to process the request. At the same time, the worker process also loads an instance of the .NET profiler.
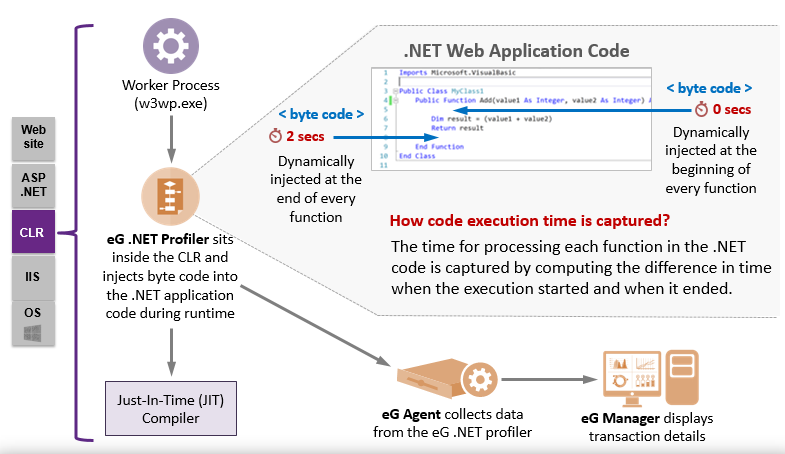
Figure 2 : How eG .NET BTM traces transaction path and computes transaction responsiveness
Once the profiler latches on to a worker process, it injects a .NET code into the .NET application code. The injected code adds a GUID to each unique transaction to the application, and performs the following tasks:
- Traces the path of a transaction;
- Measures the responsiveness of a transaction by computing the time difference between when the transaction started and when it ended;
- Identifies the slow, stalled, and error transactions, and computes the count of such transactions;
- Discovers the exit calls made by a transaction from the IIS web server, determines the destination of the calls, and measures the average time taken by each call to process the requests for a transaction;
The profiler then sends all these statistics to the eG agent. To know how and when the profiler transmits metrics to the eG agent, refer to the How Does the .NET Profiler Communicate with the eG Agent?
The eG agent reports these metrics to the eG manager. The eG manager associates these metrics with the .NET Transactions layer of the target IIS web server, and displays them in the eG monitoring console.
![]()
Figure 3 : The .NET Transactions layer displaying the .NET business transactions that are being monitored on the target IIS web server