
Terminal Users Test
A Parallels RAS environment is a shared environment in which multiple users connect to a server/server farm and access a wide variety of applications. When server resources are shared, excessive resource utilization by a single user could impact the performance for other users. Therefore, continuous monitoring of the activities of each and every user on the server is critical. Towards this end, the this test assesses the traffic between the user terminal and the Parallels RAS, and also monitors the resources taken up by a user's session on the server. The results of this test can be used in troubleshooting and proactive monitoring. For example, when a user reports a performance problem, an administrator can quickly check the bandwidth usage of the user's session, the CPU/memory/disk usage of this user's session as well as the resource usage of other user sessions. The admin also has access to details on what processes/applications the user is accessing and their individual resource usage. This information can be used to spot any offending processes/ applications.
Target of the test : A Parallels RAS
Agent deploying the test : An internal agent
Outputs of the test : One set of results for every user logged into the Parallels RAS
| Parameter | Description |
|---|---|
|
Test period |
How often should the test be executed |
|
Host |
The host for which the test is to be configured |
|
Port |
Refers to the port used by the Terminal server |
|
Usernames |
Specify the name of the user whose performance statistics need to be generated. Multiple user names can be specified as a comma-separated list. all is used to indicate that all users of the terminal server are to be monitored. |
|
DD Frequency |
Refers to the frequency with which detailed diagnosis measures are to be generated for this test. The default is 1:1. This indicates that, by default, detailed measures will be generated every time this test runs, and also every time the test detects a problem. You can modify this frequency, if you so desire. Also, if you intend to disable the detailed diagnosis capability for this test, you can do so by specifying none against DD Frequency. |
|
Detailed Diagnosis |
To make diagnosis more efficient and accurate, the eG Enterprise embeds an optional detailed diagnostic capability. With this capability, the eG agents can be configured to run detailed, more elaborate tests as and when specific problems are detected. To enable the detailed diagnosis capability of this test for a particular server, choose the On option. To disable the capability, click on the Off option. The option to selectively enabled/disable the detailed diagnosis capability will be available only if the following conditions are fulfilled:
|
| Measurement | Description | Measurement Unit | Interpretation |
|---|---|---|---|
|
User sessions |
Represents the current number of sessions for a particular user |
Number |
A value of 0 indicates that the user is not currently connected to the Parallels RAS. |
|
CPU usage of user’s processes |
The CPU utilization for a session is the percentage of time that all of the threads/processes of a user session used the processor to execute instructions. If a user is connected via multiple sessions, the value reported is the sum of all CPU utilizations across all the sessions. |
Percent |
This value indicates the percentage of Cpu resources that are used by applications run by this user. Excessive CPU usage by a user can impact performance for other users. Check the detailed diagnosis to view the offending processes/applications. |
|
Memory usage of user’s processes |
This value represents the ratio of the resident set size of the memory utilized by the user to the physical memory of the host system, expressed as a percentage. If a user is connected via multiple sessions, the value reported is the sum of all memory utilizations across all the sessions. |
Percent |
This value indicates the percentage of memory resources that are used up by a specific user. By comparing this value across users, an administrator can identify the most heavy users of the terminal server. Check the detailed diagnosis to view the offending processes/applications. |
|
Input bandwidth |
Indicates the average bandwidth used for client to server communications for all the sessions of a user |
KB/Sec |
|
|
Input errors |
The average number of input errors of all types for all the sessions of a user. Example: Lost ACK's, badly formed packets, etc. |
Errors/Sec |
|
|
Output bandwidth |
Indicates the average bandwidth used for server to client communications for all the sessions of a user |
KB/Sec |
|
|
Output errors |
The average number of output errors of all types for all the sessions of a user. Example: Lost ACK's, badly formed packets, etc. |
Errors/Sec |
|
|
I/O read rate for user’s processes |
Indicates the rate of I/O reads done by all processes being run by a user. |
KBps |
These metrics measure the collective I/O activity (which includes file, network and device I/O's) generated by all the processes being executed by a user. When viewed along with the system I/O metrics reported by the DiskActivityTest, these measures help you determine the network I/O. Comparison across users helps identify the user who is running the most I/O-intensive processes. Check the detailed diagnosis for the offending processes/applications. |
|
I/O write rate for user’s processes |
Indicates the rate of I/O writes done by all processes being run by a user. |
KBps |
|
|
Faults for user’s processes |
Indicates the rate of page faults seen by all processes being run by a user. |
Faults/Sec |
Page Faults occur in the threads executing in a process. A page fault occurs when a thread refers to a virtual memory page that is not in its working set in main memory. If the page is on the standby list and hence already in main memory, or if the page is in use by another process with whom the page is shared, then the page fault will not cause the page to be fetched from disk. Excessive page faults could result in decreased performance. Compare values across users to figure out which user is causing most page faults. |
|
Virtual memory of user’s processes |
Indicates the total virtual memory being used by all processes being run by a user. |
KB |
Comparison across users reveals the user who is being a drain on the virtual memory space. |
|
Handles used by user’s processes |
Indicates the total number of handles being currently held by all processes of a user. |
Number |
A consistent increase in the handle count over a period of time is indicative of malfunctioning of programs. Compare this value across users to see which user is using a lot of handles. Check detailed diagnosis for further information. |
The detailed diagnosis of the User sessions, CPU usage of user’s processes, and Memory usage of user’s processes measures lists the processes executed by a user on the Terminal server, and reports the resource usage of each process (see Figure 1).
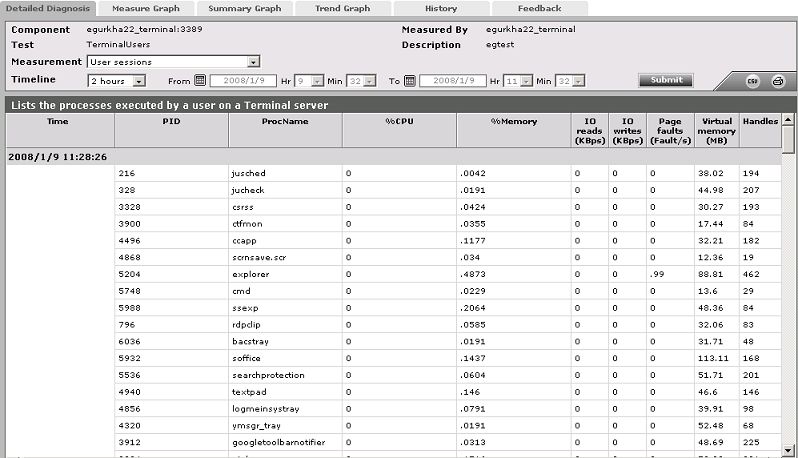
Figure 1 : The detailed diagnosis of the User sessions measure
