Shared Ethernet Adapter - VM Test
A Shared Ethernet Adapter (SEA) is a new service that acts as a Layer 2 network switch to route network traffic from a Virtual Ethernet to a real network adapter - in other words, it is a bridge from a physical Ethernet adapter to one or more Virtual Ethernet adapters.
The SEA must run in a Virtual I/O Server partition. The advantage of the SEA is that partitions can communicate outside the system without having a physical network adapter attached to the partition. Up to 18 VLANs can be shared on a single network interface. The amount of network traffic will limit the number of client partitions that are served through a single network interface.
This test measures the network traffic flowing to and from each SEA that serves the AIX partitions on a pSeries server, and helps administrators accurately isolate overloaded and error-prone SEAs, and also sheds light on potential network congestions.
This test is disabled by default. To enable the test, go to the enable / disable tests page using the menu sequence : Agents -> Tests -> Enable/Disable, pick the IBM pSeries as the desired Component type, set Performance as the Test type, choose the test from the disabled tests list, and click on the < button to move the test to the ENABLED TESTS list. Finally, click the Update button.
Target of the test : An IBM pSeries server
Agent deploying the test : A remote agent
Outputs of the test : One set of results for each SEA that serves every powered-on AIX LPAR on the IBM pSeries server being monitored.
| Parameter | Description |
|---|---|
|
Test period |
How often should the test be executed |
|
Host |
The IP address of the host for which this test is to be configured. |
|
Port |
Indicate the port at which the specified Host listens. By default, this is NULL. |
|
Real ServerName |
Specify the name of the pSeries server in the Real ServerName text box. If the target pSeries server has been auto-discovered using HMC, the server name will be set automatically in the Real ServerName text box. However, while configuring this test for a pSeries server that has been manually added, you have to explicitly provide the server name in the Real ServerName text box. Note: To obtain the real server name, a user can login to the target pSeries server as a valid pSeries user, go to the shell prompt of the server, and execute the following command: lssyscfg - r sys -F name |
|
Is Managed By |
By selecting an option from the Is Managed By list, indicate whether the target pSeries server is managed using an HMC server or an IVM (Integrated Virtual Manager) server. If the target server has been auto-discovered via an HMC server, the HMC option will be automatically chosen from this list. |
|
Management Server, Management User, Management Password |
This test connects to an HMC/IVM server to perform LPAR discovery and to collect host-level and "outside view" metrics from the pSeries server. To enable this communication, first, provide the IP address/host name of the HMC/IVM server in the Management Server text box. If the eG manager had automatically discovered the target pSeries server by connecting to an HMC server in the environment, then, the IP address/host name and user credentials pertaining to that HMC server will be automatically displayed in the Management Server, Management User, and Management Password text boxes. However, if the pSeries server being monitored was manually added to the eG Enterprise system (and not auto-discovered via the HMC server), then, you will have to explicitly indicate whether the target pSeries server is managed by an HMC server or an IVM server by selecting an option from the Is Managed By list. If the HMC option is chosen, then, you will have to provide the IP address of the HMC server that manages the target pSeries server in the Management Server text box. In such a case, in the Management User and Management Password text boxes, you will have to provide the credentials of an HMC user who is assigned the hmcviewer role. On the other hand, if the IVM option is chosen from the Is Managed By list, it implies that the IP address/host name and user credentials pertaining to that IVM server has to be explicitly provided in the Management Server, Management User, and Management Password text boxes. |
|
Confirm Password |
Confirm the HMC Password by retyping it here |
|
Domain |
Set the Domain parameter to none. |
|
Admin User, Admin Password, Confirm Password |
The eG agent remotely communicates with each discovered LPAR on the pSeries server to obtain their "inside view". For this, the eG agent will have to be configured with the credentials of a valid user with access rights to each LPAR. If a single user is authorized to access all the LPARs on the pSeries server, provide the name and password of the user in the Admin User and Admin Password text boxes, and confirm the password by retyping it in the Confirm Password text box. On the other hand, if the test needs to communicate with different LPARs using different user accounts, then, multiple user names and passwords will have to be provided. To help administrators provide these multiple user details quickly and easily, the eG administrative interface embeds a special configuration page. To know how to use this page, refer to Configuring Users for LPAR Monitoring. |
|
SSL |
By default, the HMC/IVM server (as the case may be) is not SSL-enabled. This indicates that by default, the eG agent communicates with the HMC/IVM server using HTTP. Accordingly, the SSL flag is set to No by default. If you configure the HMC/IVM server to use SSL, then make sure that the SSL flag is set to Yes, so that the eG agent communicates with the HMC/IVM server using HTTPS. |
|
Ignore VMs Inside View |
Administrators of some high security LPAR environments might not have permissions to internally monitor one/more LPARs. The eG agent can be configured to not obtain the 'inside view' of such ‘inaccessible’ VMs using the Ignore VMs Inside View parameter. Against this parameter, you can provide a comma-separated list of LPAR names, or LPAR name patterns, for which the inside view need not be obtained. For instance, your Ignore VMs Inside View specification can be: *lp,aixlp*,lin*. Here, the * (asterisk) is used to denote leading and trailing spaces (as the case may be). By default, this parameter is set to none indicating that the eG agent obtains the inside view of all LPARs on a pSeries server by default. Note: While performing LPAR discovery, the eG agent will not discover the operating system of the LPARs configured in the Ignore VMs Inside View text box. |
|
Exclude VMs |
Administrators of some virtualized environments may not want to monitor some of their less-critical LPARs both from 'outside' and from 'inside'. The eG agent in this case can be configured to completely exclude such LPARs from its monitoring purview. To achieve this, provide a comma-separated list of LPARs to be excluded from monitoring in the Exclude VMs text box. Instead of LPARs, LPAR name patterns can also be provided here in a comma-separated list. For example, your Exclude VMs pecification can be: *lp,aixlp*,lin*. Here, the * (asterisk) is used to denote leading and trailing spaces (as the case may be). By default, this parameter is set to none indicating that the eG agent obtains the inside and outside views of all AIX LPARs on a virtual host by default. By providing a comma-separated list of LPARs/LPAR name patterns in the Exclude VMs text box, you can make sure the eG agent stops collecting 'inside' and 'outside' view metrics for a configured set of LPARs. |
| Measurement | Description | Measurement Unit | Interpretation |
|---|---|---|---|
|
Packets transmitted |
Indicates the number of packets transmitted successfully by this SEA.
|
Number |
These measures are good indicators of the level of network traffic handled by the SEA. |
|
Packets received |
Indicates the number of packets received successfully by this SEA. |
Number |
|
|
Data transmitted |
Indicates the rate at which data is transmitted by this SEA. |
KB/Sec |
|
|
Data received |
Indicates the rate at which data is received by this SEA. |
KB/Sec |
|
|
Output errors |
Indicates the number of output errors encountered on this SEA. |
Number |
This is a counter for unsuccessful transmissions due to hardware or network errors. Ideally, this value should be 0. You can compare this value across SEAs to know which SEA is experiencing the maximum number of output errors, and which AIX LPAR that SEA is associated with. |
|
Input errors |
Indicates the number of input errors encountered on this SEA. |
Number |
This is a counter for unsuccessful reception due to hardware/network errors. Ideally, the value of this measure should be 0. You can compare this value across SEAs to know which SEA is experiencing the maximum number of input errors, and which AIX LPAR that SEA is associated with. |
|
Transmitted packets dropped |
Indicates the number of packets accepted by the device driver for transmission which were not (for any reason) given to this SEA. |
Number |
|
|
Received packets dropped |
Indicates the number of packets received by the device driver from this SEA which were not (for any reason) given to a network demuxer. |
Percent |
|
As stated earlier, by default, clicking on the Virtual Servers layer of a managed IBM pSeries server, leads you to a page displaying the current status of the LPAR guests executing on that server. If you want to override this default setting - i.e., if you prefer to view the tests mapped to the Virtual Servers layer first, and then proceed to focus on individual guest performance, follow the steps given below:
- Edit the eg_ui.ini file in the <EG_INSTALL_DIR>\manager\config directory
- Set the LAYERMODEL_LINK_TO_VIRTUAL flag in the file to false; this is set to true by default.
- Save the eg_ui.ini file.
Doing so ensures that as soon as the Virtual Servers layer is clicked, the list of tests mapped to that layer appears, as depicted by Figure 1.
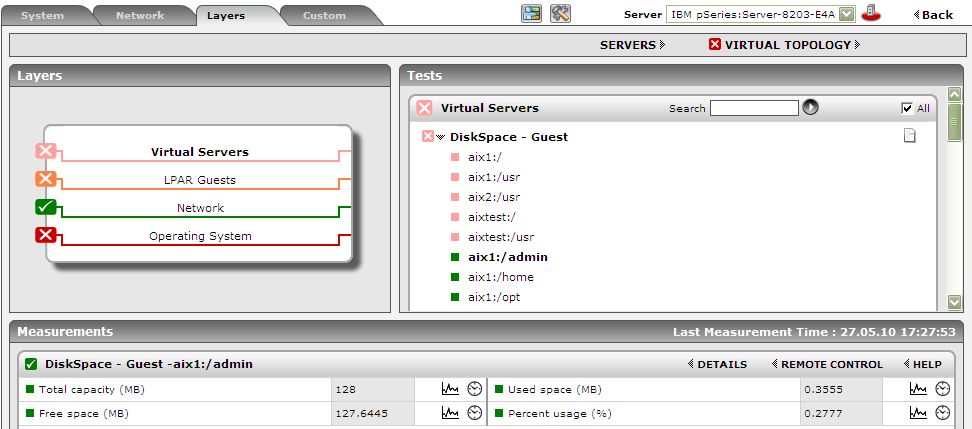
Figure 1 : The tests mapped to the Virtual Servers layer
If you now want the Server view, simply click on the Servers link above the list of tests in Figure 1 (indicated by the arrow).
Clicking on any of the guests in the Server view leads you to Figure 2 that displays all the performance metrics extracted from that LPAR, in real-time. You are thus enabled to cross-correlate across the various metrics, and quickly detect the root-cause of current/probable disturbances to the internal health of an LPAR. To view the time-of-day variations in a measure, you can view its graph by clicking on that measure in Figure 2.
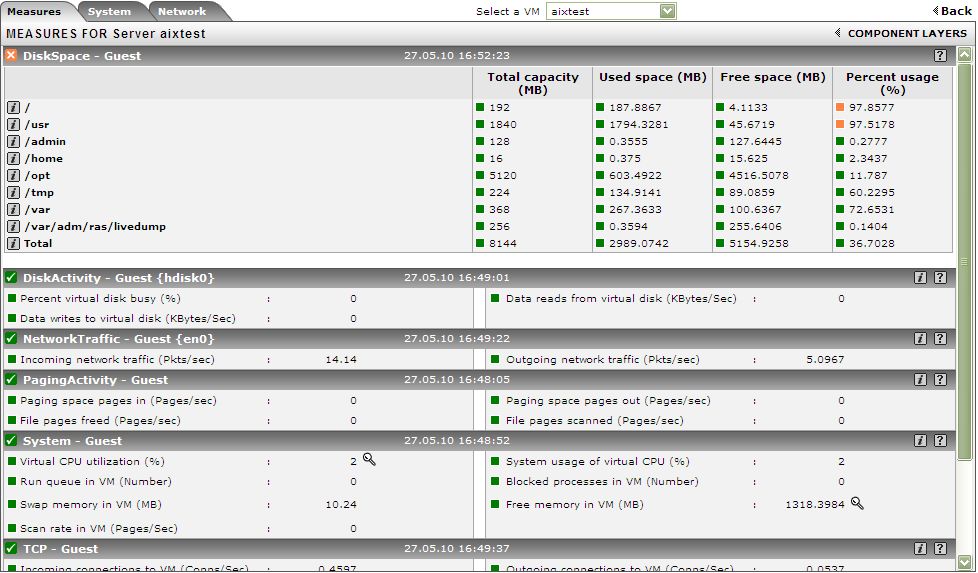
Figure 2 : Measures pertaining to a chosen LPAR
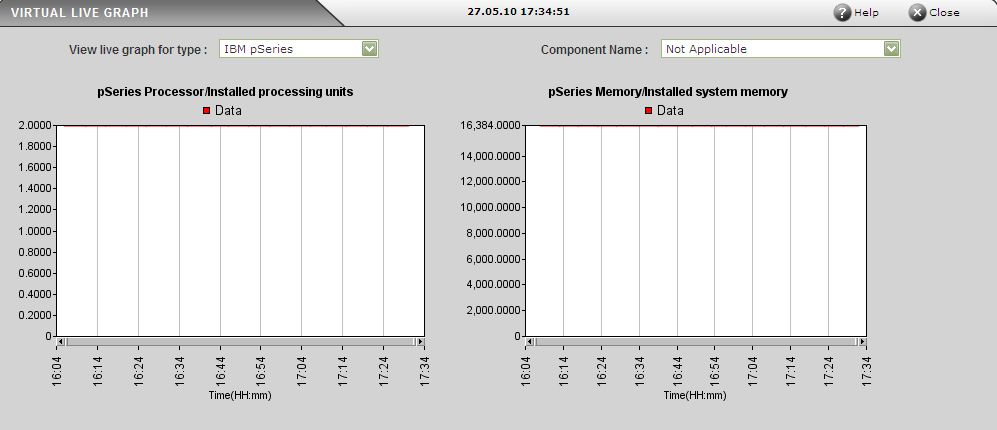
To view real-time graphs of pre-configured measures (pertaining to the pSeries host and the LPARs operating on it), click on the live graph link in Figure 3. Using this graph, you can easily assess how well the CPU, memory, and disk resources are being utilized by the LPARs. On the basis of this analysis, you can proactively isolate potential performance issues, and also determine the root-cause of the issue.