pSeries Processors Test
This test reports the quantity of allocated and unallocated physical CPU resources of the pSeries server, and the percentage of allocated CPU that has been utilized by the LPARs on that server. In the process, the test helps assess the impact of the guest CPU usage on the physical CPU resources of the pSeries server. If the server experiences a CPU contention, then this test will enable you to figure out whether the resource-crunch is owing to improper CPU allocation to the LPARs, or the existence of one/more CPU-intensive processes on the LPARs.
Target of the test : An IBM pSeries server
Agent deploying the test : A remote agent
Outputs of the test : One set of results for the IBM pSeries server being monitored.
| Parameter | Description |
|---|---|
|
Test period |
How often should the test be executed |
|
Host |
The IP address of the host for which this test is to be configured. |
|
Port |
Indicate the port at which the specified Host listens. By default, this is NULL. |
|
Real ServerName |
Specify the name of the pSeries server in the Real ServerName text box. If the target pSeries server has been auto-discovered using HMC, the server name will be set automatically in the Real ServerName text box. However, while configuring this test for a pSeries server that has been manually added, you have to explicitly provide the server name in the Real ServerName text box. Note: To obtain the real server name, a user can login to the target pSeries server as a valid pSeries user, go to the shell prompt of the server, and execute the following command: lssyscfg - r sys -F name |
|
Is Managed By |
By selecting an option from the Is Managed By list, indicate whether the target pSeries server is managed using an HMC server or an IVM (Integrated Virtual Manager) server. If the target server has been auto-discovered via an HMC server, the HMC option will be automatically chosen from this list. |
|
Management Server, Management User, Management Password |
This test connects to an HMC/IVM server to perform LPAR discovery and to collect host-level and "outside view" metrics from the pSeries server. To enable this communication, first, provide the IP address/host name of the HMC/IVM server in the Management Server text box. If the eG manager had automatically discovered the target pSeries server by connecting to an HMC server in the environment, then, the IP address/host name and user credentials pertaining to that HMC server will be automatically displayed in the Management Server, Management User, and Management Password text boxes. However, if the pSeries server being monitored was manually added to the eG Enterprise system (and not auto-discovered via the HMC server), then, you will have to explicitly indicate whether the target pSeries server is managed by an HMC server or an IVM server by selecting an option from the Is Managed By list. If the HMC option is chosen, then, you will have to provide the IP address of the HMC server that manages the target pSeries server in the Management Server text box. In such a case, in the Management User and Management Password text boxes, you will have to provide the credentials of an HMC user who is assigned the hmcviewer role. On the other hand, if the IVM option is chosen from the Is Managed By list, it implies that the IP address/host name and user credentials pertaining to that IVM server has to be explicitly provided in the Management Server, Management User, and Management Password text boxes. |
|
Confirm Password |
Confirm the HMC Password by retyping it here |
|
Domain |
Set the Domain parameter to none. |
|
Admin User, Admin Password, Confirm Password |
The eG agent remotely communicates with each discovered LPAR on the pSeries server to obtain their "inside view". For this, the eG agent will have to be configured with the credentials of a valid user with access rights to each LPAR. If a single user is authorized to access all the LPARs on the pSeries server, provide the name and password of the user in the Admin User and Admin Password text boxes, and confirm the password by retyping it in the Confirm Password text box. On the other hand, if the test needs to communicate with different LPARs using different user accounts, then, multiple user names and passwords will have to be provided. To help administrators provide these multiple user details quickly and easily, the eG administrative interface embeds a special configuration page. To know how to use this page, refer to Configuring Users for LPAR Monitoring. |
|
SSL |
By default, the HMC/IVM server (as the case may be) is not SSL-enabled. This indicates that by default, the eG agent communicates with the HMC/IVM server using HTTP. Accordingly, the SSL flag is set to No by default. If you configure the HMC/IVM server to use SSL, then make sure that the SSL flag is set to Yes, so that the eG agent communicates with the HMC/IVM server using HTTPS. |
|
Ignore VMs Inside View |
Administrators of some high security LPAR environments might not have permissions to internally monitor one/more LPARs. The eG agent can be configured to not obtain the 'inside view' of such ‘inaccessible’ VMs using the Ignore VMs Inside View parameter. Against this parameter, you can provide a comma-separated list of LPAR names, or LPAR name patterns, for which the inside view need not be obtained. For instance, your Ignore VMs Inside View specification can be: *lp,aixlp*,lin*. Here, the * (asterisk) is used to denote leading and trailing spaces (as the case may be). By default, this parameter is set to none indicating that the eG agent obtains the inside view of all LPARs on a pSeries server by default. Note: While performing LPAR discovery, the eG agent will not discover the operating system of the LPARs configured in the Ignore VMs Inside View text box. |
|
Exclude VMs |
Administrators of some virtualized environments may not want to monitor some of their less-critical LPARs both from 'outside' and from 'inside'. The eG agent in this case can be configured to completely exclude such LPARs from its monitoring purview. To achieve this, provide a comma-separated list of LPARs to be excluded from monitoring in the Exclude VMs text box. Instead of LPARs, LPAR name patterns can also be provided here in a comma-separated list. For example, your Exclude VMs pecification can be: *lp,aixlp*,lin*. Here, the * (asterisk) is used to denote leading and trailing spaces (as the case may be). By default, this parameter is set to none indicating that the eG agent obtains the inside and outside views of all AIX LPARs on a virtual host by default. By providing a comma-separated list of LPARs/LPAR name patterns in the Exclude VMs text box, you can make sure the eG agent stops collecting 'inside' and 'outside' view metrics for a configured set of LPARs. |
|
DD Frequency |
Refers to the frequency with which detailed diagnosis measures are to be generated for this test. The default is 1:1. This indicates that, by default, detailed measures will be generated every time this test runs, and also every time the test detects a problem. You can modify this frequency, if you so desire. Also, if you intend to disable the detailed diagnosis capability for this test, you can do so by specifying none against DD frequency. |
|
Detailed Diagnosis |
To make diagnosis more efficient and accurate, the eG Enterprise embeds an optional detailed diagnostic capability. With this capability, the eG agents can be configured to run detailed, more elaborate tests as and when specific problems are detected. To enable the detailed diagnosis capability of this test for a particular server, choose the On option. To disable the capability, click on the Off option. The option to selectively enable/disable the detailed diagnosis capability will be available only if the following conditions are fulfilled:
|
| Measurement | Description | Measurement Unit | Interpretation |
|---|---|---|---|
|
Installed processing units |
Indicates the number of processing units installed on the pSeries server. |
Number |
|
|
Available processing units |
Indicates the number of free processing units on the pSeries server. |
Number |
Typically, a large number of free processing units implies that more logical partitions can be configured on the server. If the value of this measure is very low, it could mean that almost all the CPU resources have been allocated to the LPAR guests. You can use the detailed diagnosis of the Used processing units measure to accurately identify the LPAR that has been allocated the maximum CPU. |
|
Used processing units |
Indicates the total number of processing units allocated to the LPAR guests on the pSeries server. |
Number |
If the value of this measure is very high or is close to the value of the Installed processing units measure, it could mean that almost all the CPU resources of the host have been allocated to the LPAR guests. In this case, you can use the detailed diagnosis of this measure to understand how many processing units have been allocated to each LPAR, and thus accurately identify the LPAR that has been allocated the maximum CPU. |
|
Processing units utilization |
Indicates the percentage of physical CPU resources allocated to the LPAR guests. |
Percent |
If the value of this measure is very high or is close to 100%, it could mean that almost all the CPU resources of the host have been allocated to the LPAR guests. In this case, you can use the detailed diagnosis of this measure to understand how many processing units have been allocated to each LPAR, and thus accurately identify the LPAR that has been allocated the maximum CPU. |
|
Total physical processors consumed |
Indicates the total number of allocated processing units used by LPAR guests. |
Number |
The detailed diagnosis of this measure reports the number of physical processors consumed by each LPAR guest on the pSeries server. In the event of a CPU contention, you can use this information to accurately identify the LPAR which is consuming the maximum CPU. |
|
Physical processors consumed out of allocation |
Indicates the percentage of allocated CPU utilized by the LPAR guests. |
Percent |
A high value for this measure could indicate that one/more LPARs have resource-intensive processes executing on them. |
|
Physical processors utilization |
Indicates the percentage of physical CPU resources utilized by the LPAR guests. |
Percent |
A high value for this measure could indicate that one/more LPARs are over-utilizing the physical CPU resources. |
|
Total physical processors |
Indicates the total number of physical processors installed on the pSeries server. |
Number |
|
|
Dedicated processors |
Indicates the total number of dedicated processors used by the LPAR guests. |
Number |
A dedicated processor partition has an entire processor that is assigned to a partition. These processors are owned by the partition where they are running and are not shared with other partitions. Also, the amount of processing capacity on the partition is limited by the total processing capacity of the number of processors configured in that partition, and it cannot go over this capacity (unless you add or move more processors from another partition to the partition that is using a dynamic LPAR operation). |
|
Shared processors |
Indicates the total number of shared processing units used by the LPAR guests. |
Number |
A partition that has its processors virtualized from a pool of shared physical processors is a shared processor partition. When the processors are in the shared processing pool, an uncapped partition that needs more processing power can use the idle processing resources in the pool. |
You can use the detailed diagnosis of the Used processing units measure to accurately identify the LPAR that has been allocated the maximum CPU.
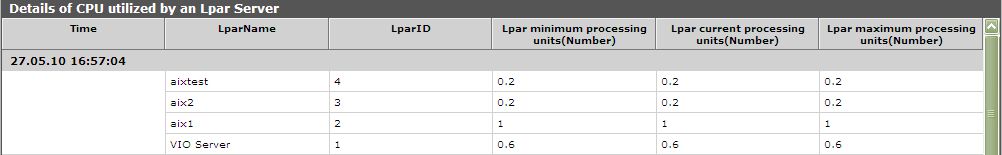
Figure 1 : The detailed diagnosis of the Used Processing Units measure
The detailed diagnosis of the Total physical processors consumed measure reports the number of physical processors consumed by each LPAR guest on the pSeries server. In the event of a CPU contention, you can use this information to accurately identify the LPAR which is consuming the maximum CPU.
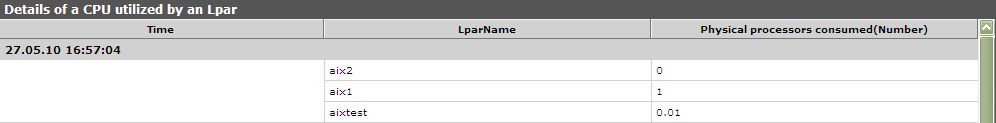
Figure 2 : The detailed diagnosis of the Total physical processors consumed measure
Configuring Users for LPAR Monitoring
In order to enable the eG agent to connect to multiple LPARs and pull out metrics from them, the eG administrative interface provides a special page using which the different Admin User names and Admin Passwords can be specified. To access this page, just click on the Click here hyperlink in any of the test configuration pages.
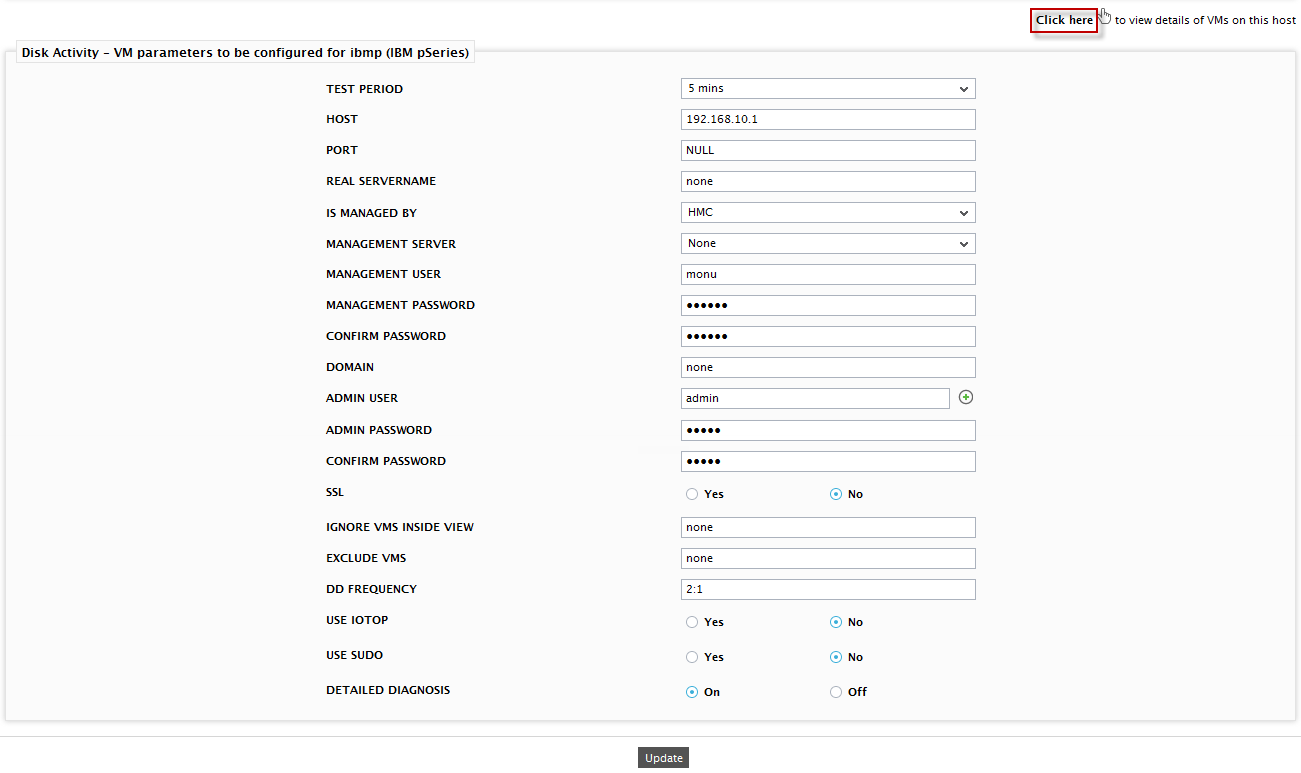
Figure 3 : Configuring a test
Upon clicking, will appear, using which the user details can be configured.
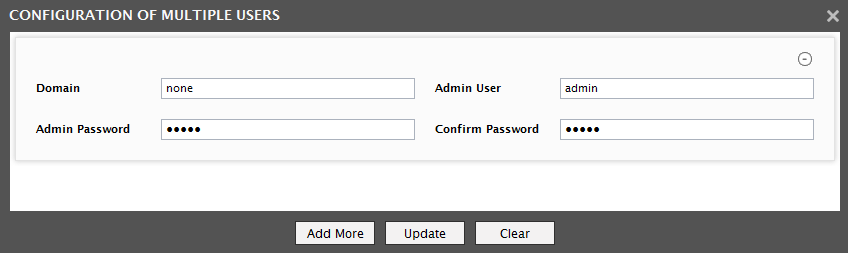
Figure 4 : The LPAR user configuration page
To add a user specification, do the following:
- By default, the Domain will be set to none (see ).
- Next, provide the credentials of a valid user to one of the LPARs in the Admin User text box.
- The password of the specified Admin User should be mentioned in the Admin Password text box.
- Confirm the password by retyping it in the Confirm Password text box.
-
To add more users, click on the Add More button in . This will allow you to add one more user specification as depicted by Figure 5.
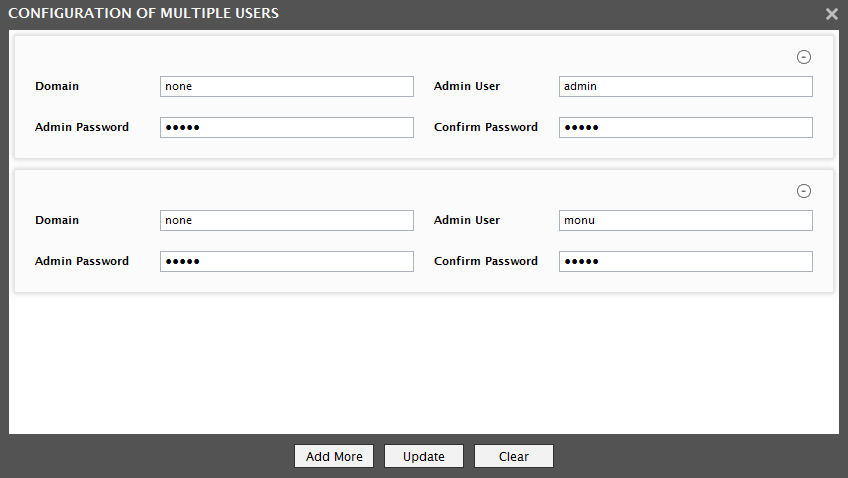
Figure 5 : Adding another user
When this is done, then, while attempting to connect to an LPAR, the eG agent will begin by using the first Admin User name of the specification. If, for some reason, the agent is unable to login using the first Admin User name, then it will try to login again, but this time using the second Admin User name of the specification. If the first login attempt itself is successful, then the agent will ignore the second Admin User name.
- To clear all the user specifications, simply click the Clear button in Figure 5.
- To remove the details of a particular user alone, just click the
 button in Figure 5.
 -
To save the specification, just click on the Update button in Figure 5. This will lead you back to the test configuration page, where you will find user names, and passwords listed against the respective fields (see Figure 6).
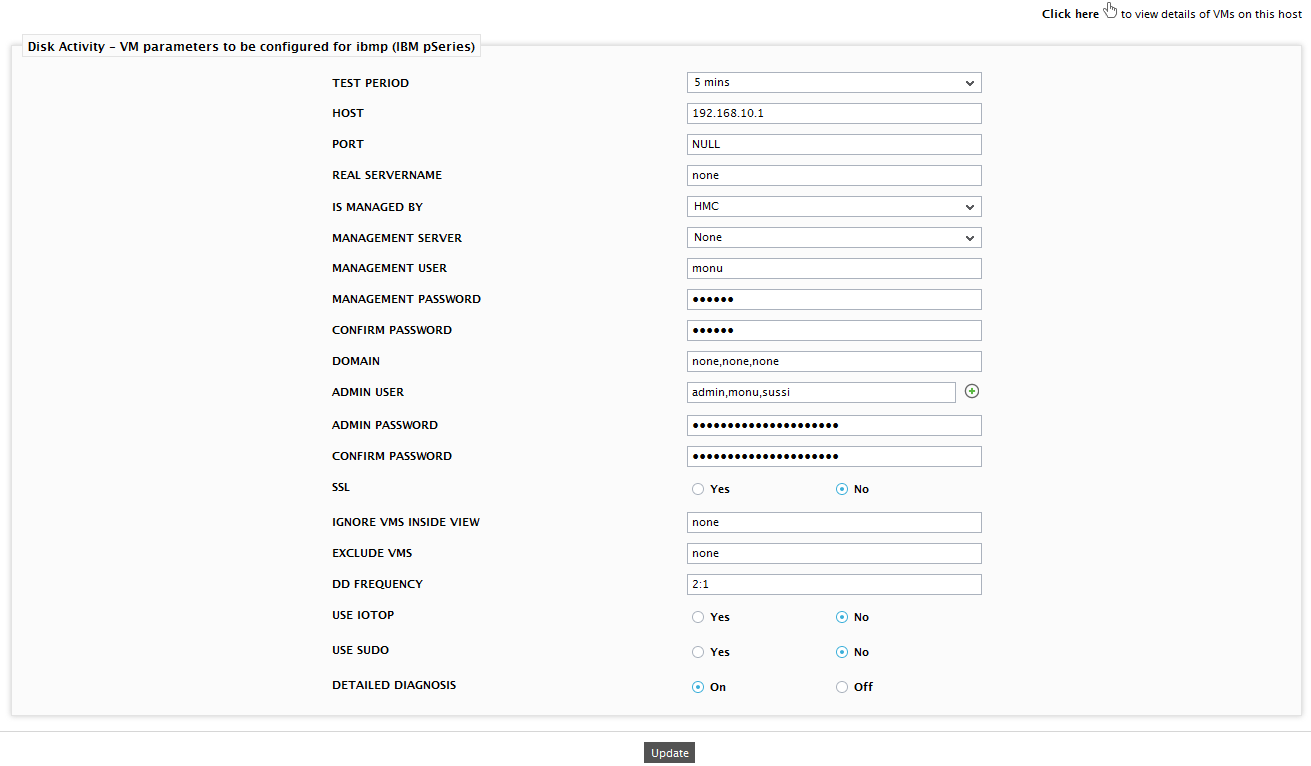
Figure 6 : The test configuration page displaying multiple user names, and passwords