Simulator Dashboard
Where two/more Amazon WorkSpaces Simulator components are managed, clicking on the Amazon WorkSpaces Simulator component-type in the Components At-A-Glance section of the Monitor dashboard automatically opens the Simulator Dashboard.
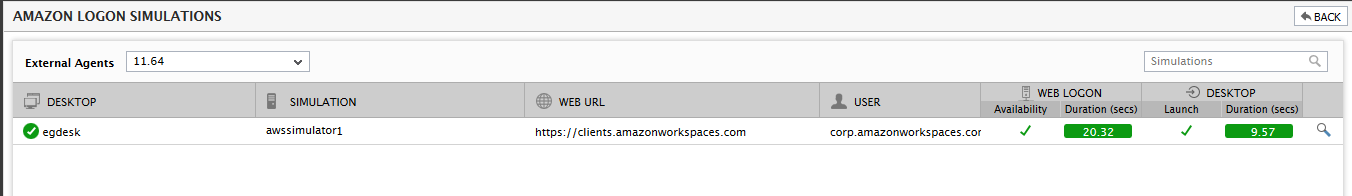
Figure 1 : The Simulator Dashboard
By default, the dashboard displays all the simulations performed by all the simulators configured in an environment. For each simulation, the dashboard displays the applications accessed and metrics captured by that simulation. This way, the simulations that failed and the precise failure points -whether login, enumeration, application launch, or logoff - of each simulation can be instantly and accurately isolated. You can even click on the 'magnifying glass' icon corresponding to a simulation for a graphical view of the logon process. Using this graphical representation, administrators can clearly identify which step of the logon process has caused slowness.
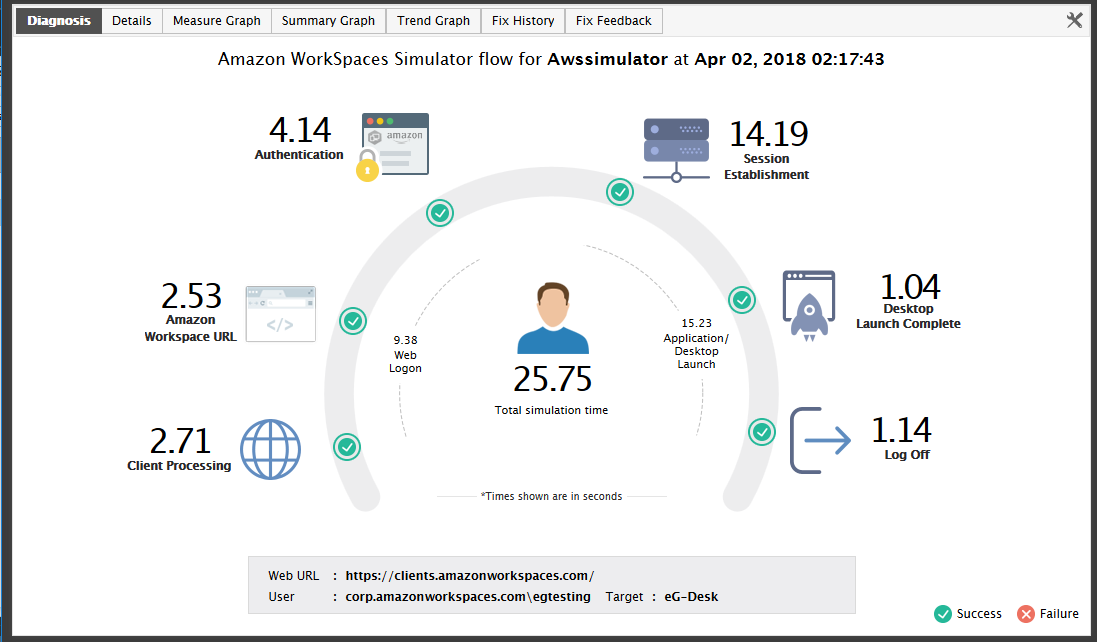
Figure 2 : A graphical view of the logon process
You can click on the Details tab page in Figure 2 to view the output of the simulation script, scrutinize it, and isolate the failure and problem points of the Amazon WorkSpaces infrastructure (see Figure 3).
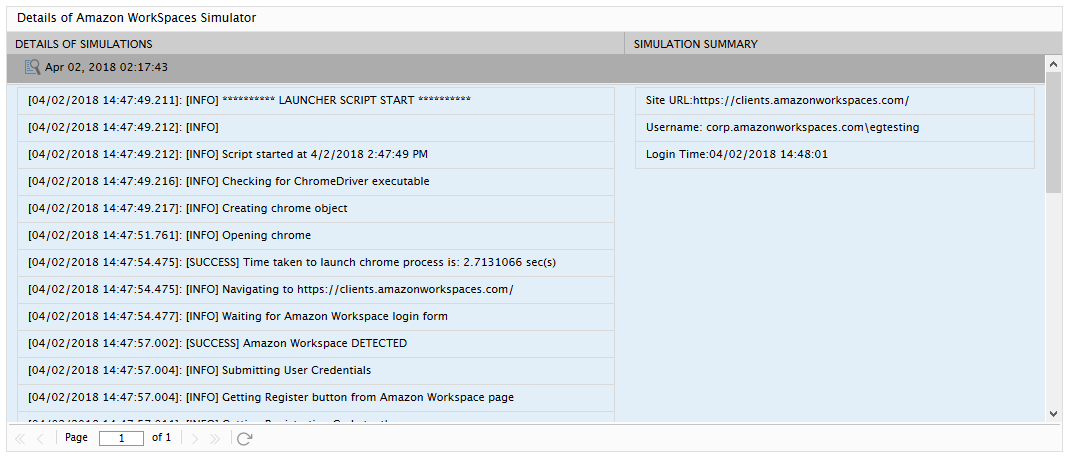
Figure 3 : The simulation script highlighting the success and failure points of the simulation
You can even filter the details displayed in the dashboard by picking the simulator for which you want to view the details. This can be achieved by picking a particular external agent from the External Agents drop-down.
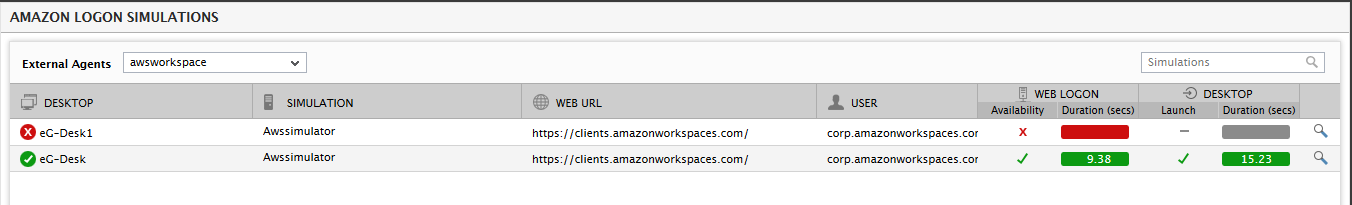
Figure 4 : Viewing the details of a particular simulator alone
Alternatively, you can filter the dashboard contents on the basis of the Amazon WorkSpaces Simulator component that you managed. You can specify the whole/part of the component name in the Simulations search text box (see Figure 5) and click the 'magnifying glass' icon alongside. This will display the details of only those components with names that contain the specified search string.
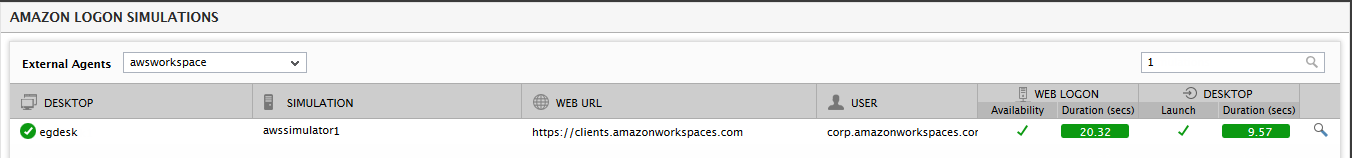
Figure 5 : Viewing the details of only those simulations that were performed using Amazon WorkSpaces Simulator components that match the specified search string
Clicking on any simulation in the dashboard will lead you to the Layers tab page, where you can view the metrics reported by the simulation and the current state of each metric.
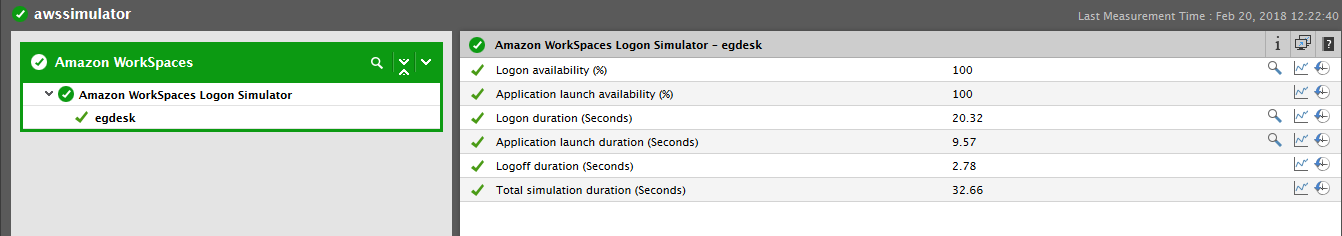
Figure 6 : The layer model of the Amazon WorkSpaces Simulator component that was clicked on