Auditing the Display Settings Changed Using the eG Configuration Management Interface
Using the Config option of the Audits menu, you can generate audit log reports that will help you instantly identify whether any changes were made to the dashboard and overall display settings of the eG Configuration Management interface, who made these change, and when.
To generate the Configuration Management related audit log reports, do the following:
- If the Configuration option is chosen from the Audits tile, Figure 182 will appear, using which you can build the report specifications.
- The default Timeline for the report is 24 hours. You can choose any other fixed period from the Timeline list, or select the Any option from this list. Choosing the Any timeline, allows you to provide a From and To date and time for report generation. If you change the Timeline settings, then make sure that you click the right-arrow button at its end, to register the changes.
- Next, select the User whose Config Management-related activities you want to audit. By default, the All option is displayed here, indicating that the report provides the details of the configuration changes effected by all users to the eG Configuration Management interface. However, if only one user has actively used the eG Configuration Management interface till date, then, by default, that user's name is displayed in the User list.
- Administrators can configure the target environment for monitoring by logging into the eG administrative interface or by using the admin command line interface provided by the eG manager. This is why, by default, the audit log not only captures those configuration changes that are effected via the web-based eG administrative interface, but also logs those activities that are performed via the eG Admin Command Line Interface.
-
While generating audit log reports, you have the option of viewing the changes across both these interfaces, or only those changes that pertain to a particular interface. To indicate your choice, use the Interface drop-down list. The options available in the Interface list are as follows:
- Web: Select this option to view those changes that were effected only via the web interface;
- Command Line: Select this option to view those changes that were effected only via the eG command line interface;
- All: Select this option to view all changes, regardless of interface.
If required, you can choose not to maintain audit logs for activities performed via the admin command line interface by setting the Include activities from the admin command line interface flag in the Auditing section of the manager settings page to No. In this case therefore, the Interface drop-down list will not appear.
Note:
The eG command line interface can currently be used only for administering the eG manager - i.e., for performing a few administrative tasks such as adding/managing components, configuring external agents/remote agents, assigning agents to secondary manager in a redundant manager setup, etc. Hence, the Interface option is currently relevant to the Admin Audit log Reports, and not the Monitor, Reporter, and Configuration Management Audit Log Reports.
- The Host IPs list displays all the IP addresses from which the chosen user(s) has accessed the eG Configuration Management interface. If you are looking for information on the accesses from specific IPs, select those IP addresses alone from the Host IPs list.
- After the Host IPs selection, the Modules list will be populated with either/all of the following options: Common Display settings and Dashboard settings (see Figure 182). The options displayed depend upon which of the two modules were accessed by the chosen user from the selected Host IPs. Select either/both the displayed modules to view the changes made by the user in the respective modules.
- Based on the selections from the Modules list, the Activities list will be populated. While working with the eG Configuration Management interface, the selected user(s) might have performed a few specific operations on the chosen Modules. eG Enterprise automatically discovers the operations that correspond to the chosen user-host IP-module combination from the audit logs, and populates the Activities list with the operations so discovered (see Figure 182). If you want the details of specific activities only, select the required options alone from the Activities list.
-
Finally, click the Show button to generate the report.
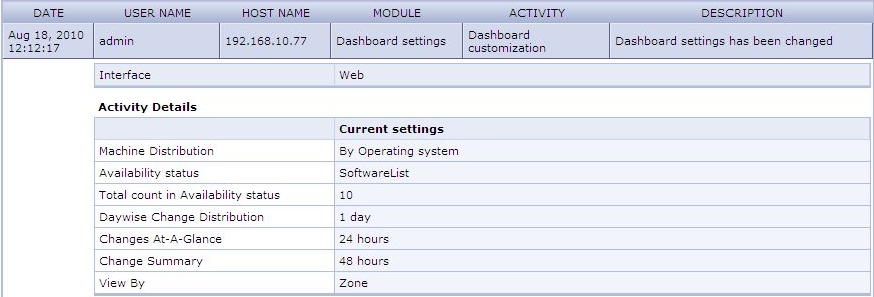
Figure 182 : Report displaying the details of display settings changed using the eG Configuration Management interface
-
The resulting report provides the following details (see Figure 182):
- The date/time of the change
- the name of the user who made the change
- the IP address of the host from which the user accessed the eG Reporter interface
- the module that was accessed by the user
- the specific operation/activity that was performed by the user on that module
- the Interface type that was used - whether web or command line
-
the detailed description of the change, followed by a snapshot of the settings prior to change, and the settings after the change; if a configuration has been newly introduced (for eg., a new schedule was created), then only the Current Settings will be displayed
Note:
By default, the every change record that the report displays will be accompanied by the Current and Previous configuration settings. This can sometimes clutter the report view, making it difficult for you to read and analyze the report. You can therefore hide both these columns from the report, by setting the ShowChanges parameter in the [audit_log_settings] section of the eg_ui.ini file to No.
-
You can print the report by clicking on the Print icon at the right, top corner of Figure 182, or save the report as a PDF file by clicking on the Save icon. You can even save the report as a CSV file by clicking on the csv icon in Figure 182.
-
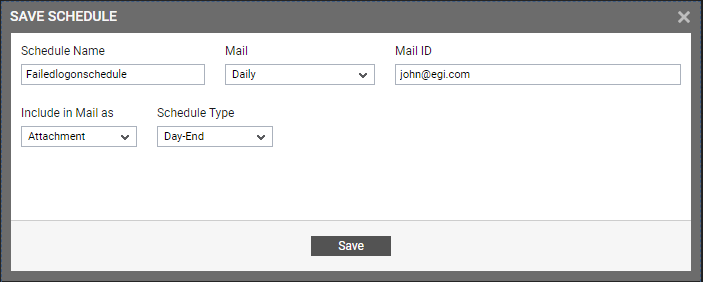
You can also schedule the audit log report to be automatically emailed to specific recipients at configured intervals. For that, click on the Schedule this Report icon in the tool bar. Figure 183 will then appear.
-
Provide the following in Figure 183:
-
Specify the Schedule Name.
-
Indicate how frequently you want eG Enterprise to mail the report by picking an option from the Mail drop-down. The options provided therein include:
Note:
-
If a report is set to be mailed 'Weekly', such a setting only ensures that the report is mailed once a week; it does not alter the Timeline of the original report. The same applies to 'Monthly' schedules.
-
By default, WeekEnd reports are mailed every Sunday. This default setting can however, be modified by editing the eg_services.ini file (in the <EG_INSTALL_DIR>\manager\config directory). The ScheduleMailWeekend parameter in the [MISC_ARGS] section of this file is set to Sunday, by default. If you so wish, you can specify any other day of the week against this parameter, as shown below:
[MISC_ARGS]
ScheduleMailWeekend=Friday
-
-
Provide a comma-separated list of Mail IDs to which the audit log report is to be emailed.
-
Indicate how you want the audit log report sent via email - as an attachment, or in the body of the email. Pick the Attachment option if you want the report to the attached to the email. To include the report in the body of the email, select the Inline option.
- Then, indicate the Schedule Type. You can indicate when report scheduling is to occur by picking an option from the Schedule Type list. To generate schedule reports at the end of every day, pick the Day-End option from this list. To generate schedule reports at a configured time every day, pick the Anytime option from this list, and then indicate the exact time of generation using the Schedule at time controls that then appear.
-
Then, click on Save to save the schedule.
Note:
-
By default, when an audit log report is emailed as per schedule, this scheduled report will display only those configuration changes that were effected from the Host IPs chosen (see Figure 1) at the time the report was originally generated. If configuration changes were made from a new IP address in the meantime - i.e., from when the schedule was created to when the scheduled report is actually emailed - then the emailed report will not carry details of those changes made from the new IP by default. This is because, the Consider_IPs_OnSchedule parameter in the [MISC_ARGS] section of the eg_services.ini file (in the <EG_MANAGER_INSTALL_DIR>\manager\config directory on Windows; on Unix, this will be the /opt/egurkha/manager/config directory) is set to Yes by default. If required, you can override this default setting by editing the eg_services.ini file and changing the value of the Consider_IPs_OnSchedule parameter to No. When this is done, then, when emailing a scheduled report, eG will disregard the Host IPs chosen for the original report. The scheduled report in this case will display changes made from any IP address, regardless of what the original selection is.
-
In a redundant setup, all the audit log reports will have an additional manager name column, which displays the IP or host name of the manager to which a record pertains.
- Concurrent updates to the eG Enterprise configuration could have a malicious effect. So the eG manager tracks admin user sessions. It times out a session after 30 minutes of inactivity. An alert is also displayed whenever the manager deletes multiple simultaneous logins.
-
By default, the title bar of the administrative interface, will display the IP address of the eG manager. However, if you wish to custom define the text on the title bar, then do the following:
- Open the eg_services.ini file in the <EG_HOME_DIR>/manager/config directory.
- Move to the [misc_args] section within and specify a title bar text of your choice against the ManagerTitle parameter. Doing so, will ensure that the defined text appears on the title bar of the administrative interface.
-