Configuring Monitor Settings
To configure the Monitor settings, select the Monitor option from the Settings tile. When Figure 1 appears, a monitor settings tree will appear in its left panel with the following nodes:
- General - This node and its sub-nodes provide you with a number of options that will enable you to effortlessly control the look, feel, and basic operations of the eG monitoring console. Each of these sub-nodes have been dealt with in great detail later in this section.
- Measures At A Glance - The Monitor dashboard can be optionally configured with a Measures At-A-Glance section. This section can be designed to provide you with a heads up on how a few critical performance parameters are currently faring, so that the hot spots in the environment can be identified almost as soon as you login to the monitoring console. This node and its sub-nodes enable you to configure the metrics that need to feature in the Measures At-A-Glance section. Each of these sub-nodes have been dealt with elaborately later in this section.
Configuring General Monitor Settings
This section describes each sub-node of the General node and the settings that can be defined using that sub-node.
-
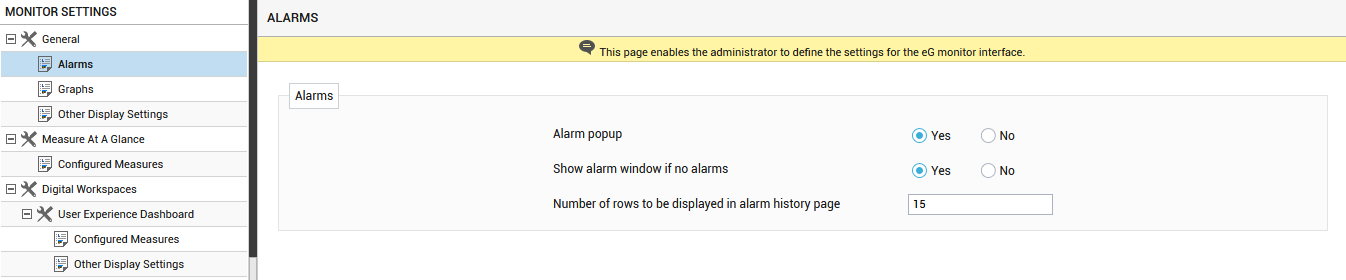
Clicking on the Alarms node invokes the Alarms page in the right panel (see Figure 1).
-
In Figure 1, specify the following:
- Alarm popup: By default, as soon as a user logs into the eG monitoring console, a current alarms window will pop-up, listing all the current performance issues in the target environment. This default behavior is governed by the Alarm popup flag, which is set to Yes by default. If you do not want the current alarms window to pop up upon logging in to the eG monitoring console, then set the Alarm popup flag to No.
- Show alarm window if no alarms - By default, the Show alarm window if no alarms flag is set to Yes indicating that the CURRENT ALARMS / UNKNOWS pop up window will appear in the eG monitoring console as soon as a user logs in even when there were no alarms raised in the target environment. If you do not wish the CURRENT ALARMS / UNKNOWNS window to pop up when there are no alarms raised in the target environment, then, set this flag to No.
- Number of rows to be displayed in the alarm history: The Event History page in the monitor interface provides a detailed history of events that have occurred in the target environment. Instead of allowing too many rows of events to crowd a single page of this display, you can spread the information across multiple pages. To ensure this, you can specify the maximum number of rows to be listed in one page of the event display, in the Number of rows to be displayed in the alarm history page text box (see Figure 1).
- Click on Update button to implement the changes.
-
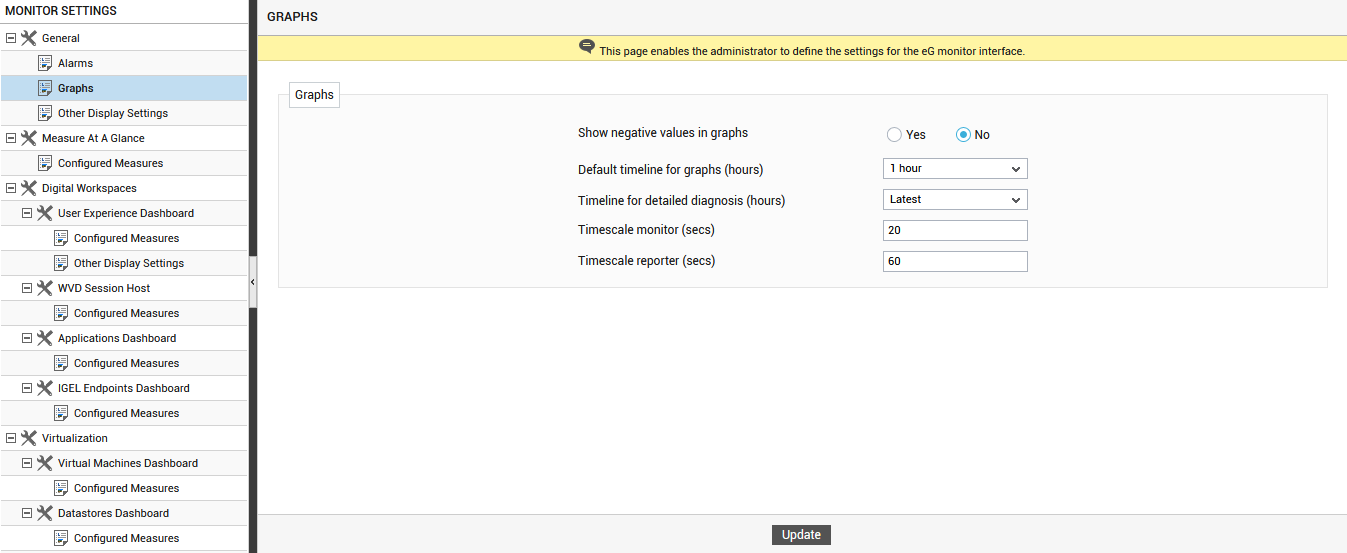
If you click on the Graphs subnode, the GRAPHS page will appear (see Figure 2).
-
In this page, you can customize the graph displays in the monitor and reporter interfaces (see Figure 2), as discussed below:
- Show negative values in graphs : eG Enterprise reports negative values when the eG agent is unable to collect data. By plotting these negative values in a graph, you can accurately determine the times when the eG agent was unable to extract performance data from target components. By default, the eG manager ignores these negative values while plotting graphs. However, if you want to view the periods when the eG agent succeeded in collecting data vis-a-vis the periods when the agent failed to collect data, then you can turn on the plotting of negative values in graphs, by setting the Show negative values in graphs flag to Yes.
- Default timeline for graphs: The default duration for measure graphs in the eG monitor interface is 1 hour. You can override this default setting by specifying a higher or lower time period (in hours) in the Default timeline for graphs text box.
- Timeline for detailed diagnosis: The default duration for detailed diagnosis in the eG monitor interface is 1 hour. You can override this default setting by specifying a higher or lower time period (in hours) in the Time line for detailed diagnosis text box.
- Timescale monitor: By default, the graphs in the monitor interface plot values averaged over every 20 seconds of the specified timeline. For instance, to plot the values of a measure gathered over an hour, by default, 180 data points will be plotted in the graph, one for every 20 seconds of data. If the default time scale remains as 20 seconds, then, longer timelines will result in a large number of data points been plotted on the graph; this, in turn, provides administrators with deeper insights into measure behavior. However, sometimes, administrators might require less granular information on the graph, so that they are able to read and analyze the graphs better. To facilitate this, eG Enterprise permits administrators to specify a custom time scale for graphs in the Timescale Monitor text box.
- Timescale reporter: Similarly, the default timescale for graphs in eG Reporter is 60 seconds. To change this setting, you need to alter the Timescale reporter specification in this page.
- Click on the Update button to implement the changes as depicted by Figure 2.
-
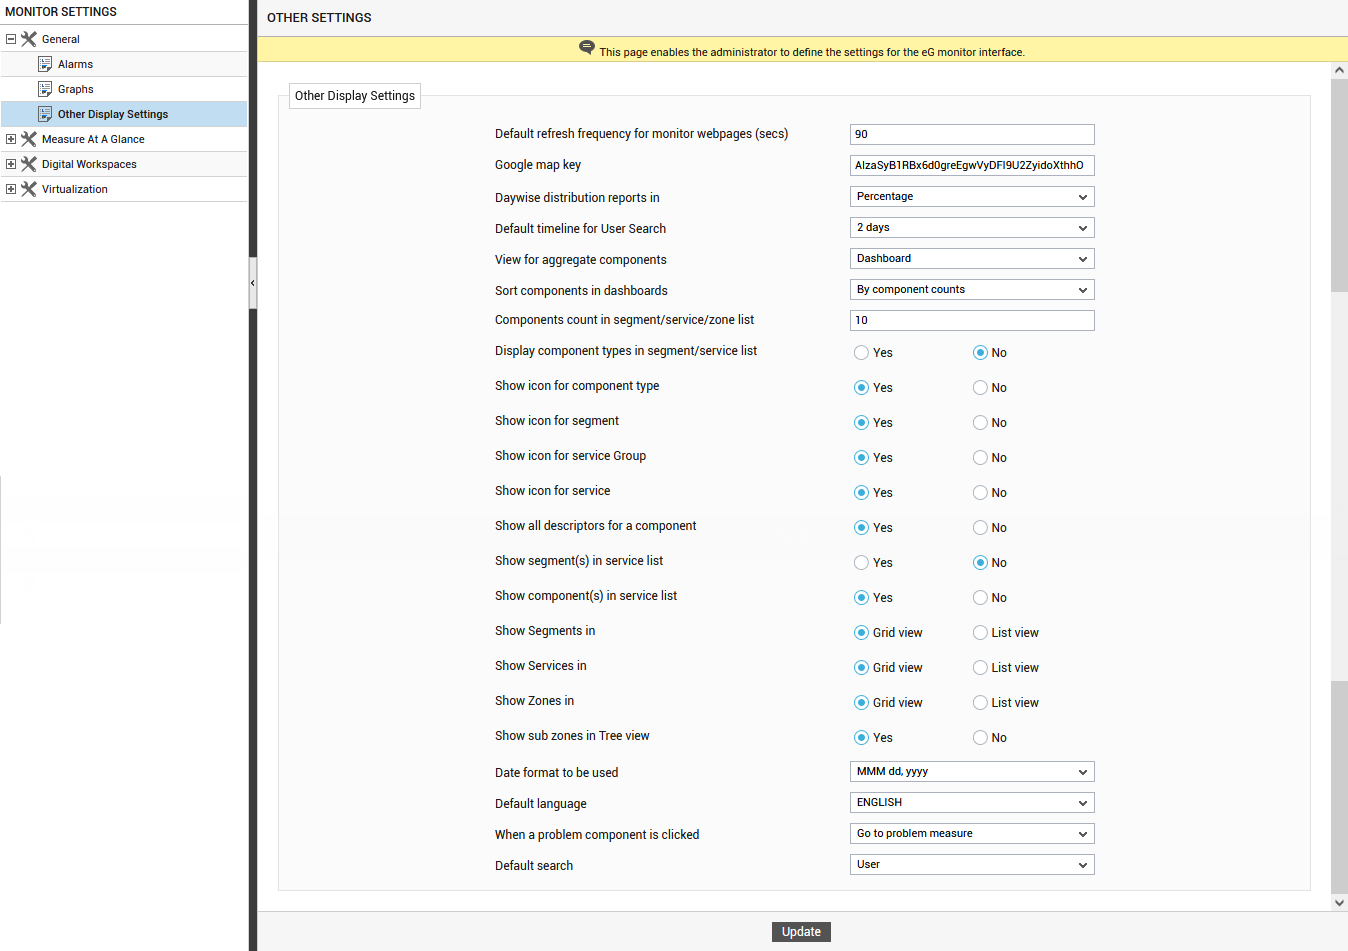
Using the Other Display Settings sub-node, you can customize the other displays in the monitor interface (see Figure 3).
-
The settings that can be configured using the Other Display Settings page are as follows:
- Default refresh frequency for monitor webpages (secs): Indicates how often the web pages of the eG monitor module need to be refreshed. By default, this is set to 90 seconds.
- Google map key: Administrators of large infrastructures spanning geographies might prefer to monitor their infrastructure by viewing it as smaller, more manageable business units. In eG parlance, these business units are termed ZONES. A zone can comprise of individual components, segments, services, and/or other zones that require monitoring. Typically, zones can be used to represent the status of the IT infrastructure in a specific geographic location. eG Enterprise allows you to drill down on a geographic map to visually figure out the exact geographic area where a zone operates, and instantly evaluate the performance of the different zones spread across the different locations worldwide. The geographic map display for zones is achieved through an integration of the eG Enterprise management console with the Google maps service. To enable the integration, a Google Maps API key is required. This key is bundled into the eG manager, and is automatically displayed here.
- Daywise distribution reports in : By default, the Event Duration Analysis section in the Reporter Dashboard and Executive Reports depicts the duration (in minutes) for which the target environment/entity (as the case may be) had experienced performance issues every day during the given Timeline. Instead of the problem 'minutes' per day, if you want this day-wise event distribution to indicate the 'percentage of time' every day the target entity suffered performance degradations, then set the Daywise distribution reports in flag to Percentage.
- Default timeline for User Search:
- View for aggregate components: This option will be available only if the eG license enables Metric Aggregation. If so, then, you can pick an option from this list to indicate the default view for aggregate components in the eG monitoring console. If the Dashboard option is chosen, then, clicking on an aggregate component in the monitoring console will invoke the aggregate dashboard. Selecting the LayerModel option on the other hand, will lead you to the layer model of the aggregate component that you click on.
- Sort components in dashboards: By default, in the Components At-A-Glance section of the Monitor and Zone dashboards, the component-types are sorted in the descending order of the values in the Count column of the section. If you want to change this default sort order - i.e., if you want the contents of this section to be arranged in the alphabetical order of the component-types by default - set the Sort components in dashboards flag to By component types.
- Components count in segment/service/zone list: The segment list, service list, and zone list pages in the eG monitoring console reveal the current state of all the segment, services, and zones (respectively) that have been configured in the target environment. To make sure that the lists are not cluttered, by default, against each segment/service/zone displayed in these pages, only the top-10 components associated with that segment/service/zone will be displayed. This is because, the Component count in segment/service/zone list is set to 10 by default. The top-10 component list is arrived at by sorting all the components associated with a segment/service/zone on the basis of their current state and then arranging them in the alphabetical order of the component names. If you want more components to be displayed in these pages, then, you can specify a value of your choice in the Component count in segment/service/zone list text box. To display all components, specify -1 here.
- Display component types in segment/service list : Some administrators might prefer to view the abnormal component-types associated with a problem segment/service, rather than component names, in the SERVICE LIST or SEGMENT LIST pages. To achieve this, such administrators can set the Display component types in segment/service list flag to Yes.
- Show icon for component type : By default, an icon prefixes every component listing in the COMPONENT LIST page of the eG monitor interface, representing the component-type. In target environments where a large number of components are managed, these icons could cramp the component display. To avoid this, you can set the Show icon for component type flag to No. Doing so removes the icons from the COMPONENT LIST page, and replaces them with the names of the corresponding component-types.
- Show icon for segment: By default, an icon prefixes every segment listing in the segment LIST page of the eG monitor interface, representing the segment. In target environments where a large number of segments are managed, these icons could cramp the display. To avoid this, you can set the Show icon for segment flag to No. Doing so removes the icons from the segment LIST page.
- Show icon for service group: By default, an icon prefixes every service group listing in the service groups LIST page of the eG monitor interface, representing the service group. In target environments where a large number of service groups are configured, these icons could cramp the display. To avoid this, you can set the Show icon for service group flag to No. Doing so removes the icons from the service group list page.
- Show icon for service: By default, an icon prefixes every service listing in the service LIST page of the eG monitor interface, representing the service. In target environments where a large number of services are configured, these icons could cramp the display. To avoid this, you can set the Show icon for service flag to No. Doing so removes the icons from the service list page.
- Show all descriptors for a component: By default, when you click on a particular layer in the monitoring model of a component, all the tests mapped to that layer, and all descriptors that have been enabled for the descriptor-based tests (if any), will be displayed in the Tests panel of the layer model page. Some tests support a large number of descriptors. For instance, the UserProfileTest reports the profile size of each and every user to a Citrix or Terminal server. When such descriptors are displayed, they will naturally crowd the Tests panel. To enhance the 'look and feel' of the layer model page, you can switch off descriptor display by default. To ensure this, set the Show all descriptors for a component flag to No.
- Show segment(s) in service list: By default, against each service displayed in the service list page in the eG monitoring console, only the components (top-10, by default) associated with that service will be displayed. This is why, the Show segment(s) in service list flag is set to No by default. If you want the segments associated with a service to also be displayed alongside the service name, then set this flag to Yes.
-
Show component(s) in service list: By default, against each service displayed in the service list page in the eG monitoring console, the components (top-10, by default) associated with that service will be displayed. Accordingly, the Show component(s) in service list page is set to Yes by default. To hide the component list, set this flag to No.
Note:
If required, you can set both the Show segment(s) in service list and Show component(s) in service list flags to No. If this is done, then neither the segments nor the components associated with a service will be displayed against the service name in the service list page. Instead, you will only find a list of fully-configured services and their state in this page.
- Show Segments in: Indicate how segments are to be displayed by default in the eG monitoring console. Select the List view option if the segments are to be displayed in a vertical list. By default, the Grid view option is chosen indicating that the segments will be listed in a grid format.
- Show Services in: Indicate how services are to be displayed by default in the eG monitoring console. Select the List view option if the services are to be displayed in a vertical list. By default, the Grid view option is chosen indicating that the services will be listed in a grid format.
- Show Services in: Indicate how services are to be displayed by default in the eG monitoring console. Select the List view option if the services are to be displayed in a vertical list. By default, the Grid view option is chosen indicating that the services will be listed in a grid format.
- Show Zones in: Indicate how zones are to be displayed by default in the eG monitoring console. Select the List view option if the zones are to be displayed in a vertical list. By default, the Grid view option is chosen indicating that the zones will be listed in a grid format.
- Show sub zones in Tree view: Specify whether sub zones should be displayed as a separate node in the ZONES tree in the eG monitoring console. By default, this flag is set to Yes. If this flag is set to No, then, the sub zones will not be displayed in the ZONES tree. Instead, when the zone containing the sub zone is expanded, the sub zone would be expanded by default in the ZONES tree in the eG monitoring console.
- Date format to be used: The default date format for the eG user interface is MMM dd, yyyy. You can change this default format depending upon the country you are in, by selecting a different format from the Date format to be used list
- Default language: The eG manager provides multi-language support, but the default language is 'ENGLISH'. To configure the eG manager to support a different language by default, select the language of your choice from the Default language list.
- When a problem component is clicked: Select an option from this list to indicate what should happen when a problem component is clicked in the eG monitoring console. By default, clicking on a problem component leads you the layer model page, where you can directly view the problem layer, problem test, and problem measure. Accordingly, the Go to problem measure option is chosen from this list by default. On the other hand, if you want only the layer model of the problem component to appear when you click on it, then, pick the Go to layer model option from this list. In this case, you will have to manually drill down from the layer model to the problem measure.
- Default search:
- Finally, click the Update button to register the changes as depicted by Figure 3.
Configuring Measures At-A-Glance
By default, the Monitor Dashboard provides a Measures At-A-Glance panel, which allows users to view the min/max values of critical measurements updated in real-time. Users can thus receive instant status updates on sensitive performance parameters, and can also accurately determine, at a single glance, the pain points of an infrastructure. To configure the measures which need to be listed in the Measures At-A-Glance section, you can use the Measures At A Glance node in the monitor settings tree-structure and its sub-nodes.
- First, expand the Measures At A Glance node in the monitor settings tree in the left panel. Then, click the Configured Measures sub-node (see Figure 4).
-
The configured measures page will then appear in the right panel (see Figure 4).
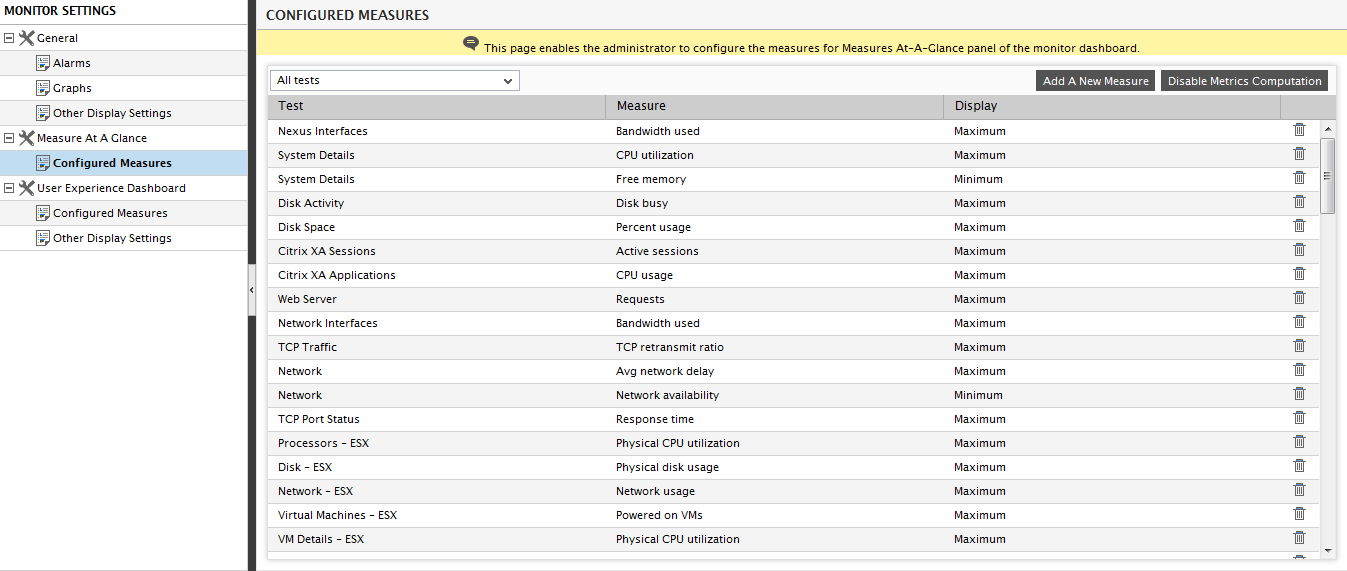
- Since the Measures At-A-Glance section appears by default in the Monitor Dashboard, the configured measures page of Figure 4 displays the complete list of metrics pre-configured for that section. If you want to hide this section from the Monitor Dashboard, just click the Disable Metrics Computation button in Figure 4.
-
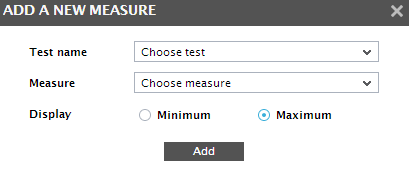
On the other hand, if you to add a new measure to the section, click on the Add New Measure button in Figure 4. An add a new measure pop up window will then appear (see Figure 5).
-
To add more measures to the Measures At-A-Glance section, first select a test from the Test name list in Figure 5. All the measures that are reported by the chosen test will then populate the Measures list. From this list, select the measure that should appear in the Measures At-A-Glance section of the Monitor Dashboard. Then, indicate whether the maximum/minimum value of the measure should be displayed in the Measures At-A-Glance section, by selecting either the Maximum or the Minimum flag against the Display section. To add the measure, click on the Add button therein. In the same way, you can add multiple measures for display in the Measures At-A-Glance section.
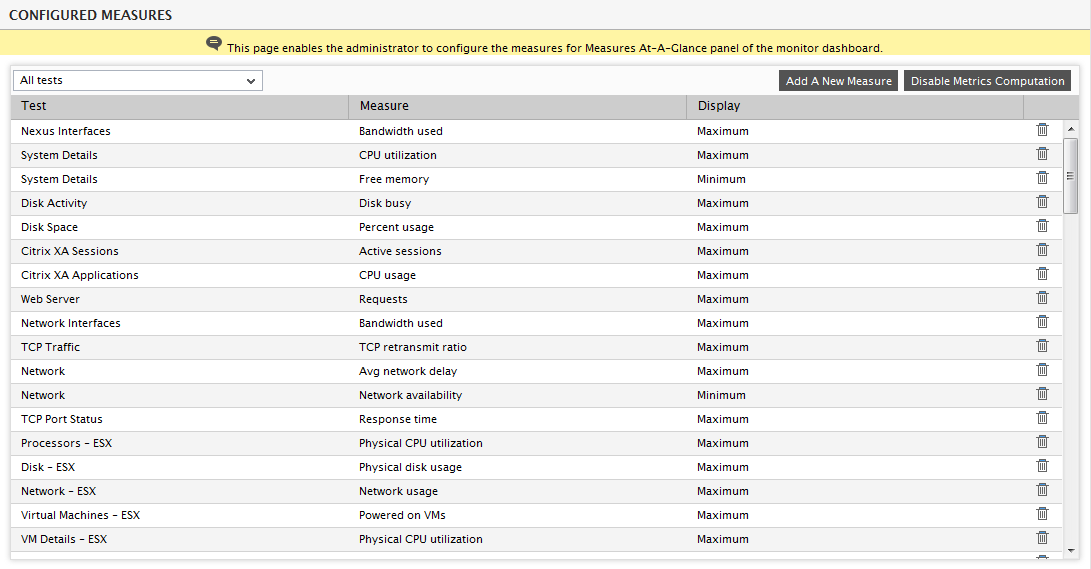
- You can view a pre-configured list of measures and their corresponding min/max settings in the right panel of Figure 6. To delete any of the measures that pre-exist, click on the Delete button corresponding to that measure.
Configuring the User Experience Dashboard
The User Experience dashboard provided by the eG Enterprise helps end-users themselves to view the performance metrics related to their access to the Citrix/VDI/Terminal server infrastructure. Using this dashboard, end users can easily determine when they see a slowdown, is the problem being caused by connectivity to the Citrix/VDI infrastructure, by any application(s) that they are using within a Citrix session, or by the Citrix infrastructure itself. If a performance problem is in the interconnecting network or in one of the applications the user has launched, the user can initiate corrective action (e.g., kill the offending process, contact the local network team, etc.) to alleviate the issue. To configure the measures which need to be highlighted in the User Experience Dashboard, you can use the User Experience Dashboard node under the Digital Workspace node in the MONITOR SETTINGS tree-structure and its sub-nodes.
- First, expand the User Experience Dashboard node under the Digital Workspace node in the monitor settings tree in the left panel. Then, click the Configured Measures sub-node (see Figure 7).
-
The configured measures page will then appear in the right panel (see Figure 7).
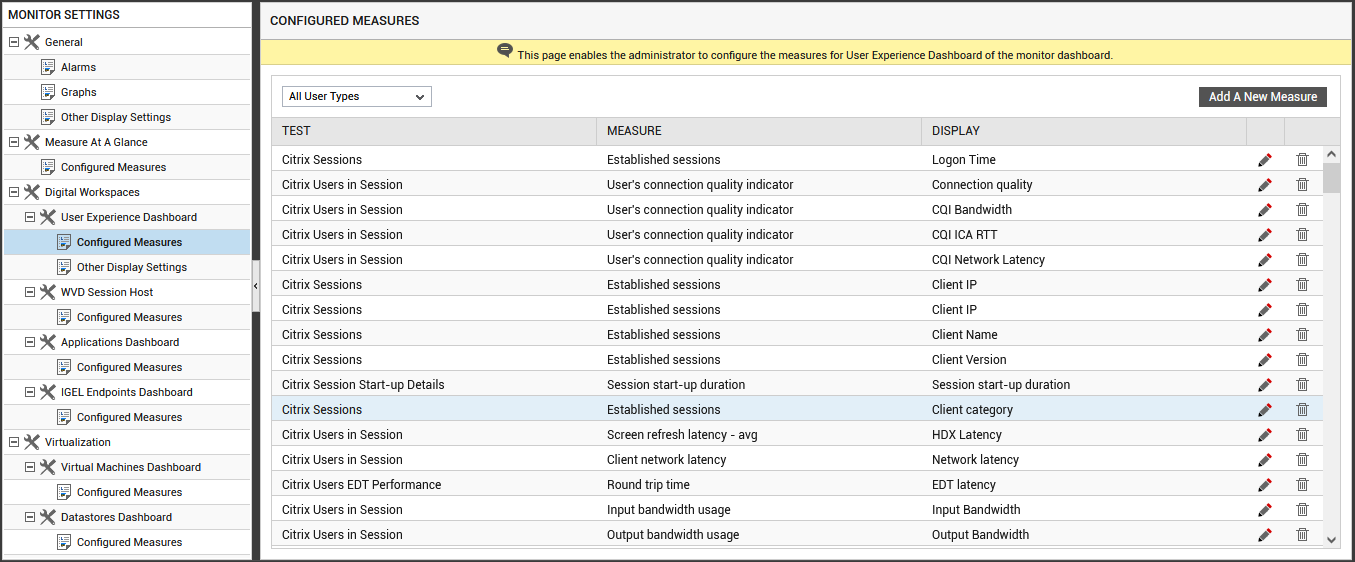
Figure 7 : The measures configured for the User Experience Dashboard
- You can configure the User Experience Dashboard with a different set of measures for different types of users (i.e., VDI/XenApp/Terminal) in your environment. By default, the All User Types option (See Figure 7) is chosen from the list box indicating that the CONFIGURED MEASURES page displays the complete list of metrics pre-configured for display in the User Experience Dashboard, irrespective of the types of users in your environment. If you wish to view the measures that are relevant only to your VDI/XenAPP/XenApp7/Terminal servers, then you can select the appropriate option from the list box.
-
On the other hand, if you to wish to view the performance of a measure that is not pre-defined in this section, click on the Add New Measure button in Figure 7. An add a new measure pop up window will then appear (see Figure 8).
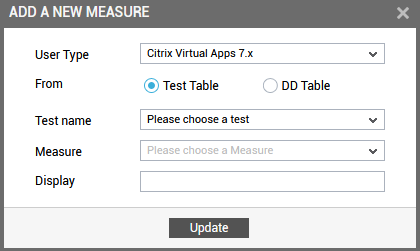
Figure 8 : Adding a new measure for display in the User Experience dashboard
-
To add more measures to the User Experience Dashboard section, do the following:
- First select a user type from the User Type list of Figure 8.
Then, use the Test and DD options given against the From flag to add either a measure reported by a test or a detailed measure revealed by the detailed diagnosis of a measure. By default, Test is chosen against this flag (see Figure 8).
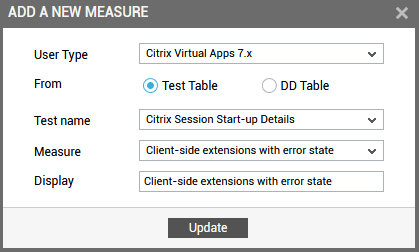
Figure 9 : Selecting test measure for display in the User Experience dashboard
Now, specify the following in Figure 9:
- Select a test from the Test name list in Figure 9.
- All the measures that are reported by the chosen test will then you want to be populated in the Measures list.
- From this list, select the measure that should appear in the User Experience Dashboard.
- Then, specify the display name of the measure in the Display text box i.e., you can override the default name of the measure and provide the name of your choice for the chosen Measure.
-
On the other hand, if you wish to display additional information that is a part of the detailed diagnosis of a measure, then select DD option against the From flag.
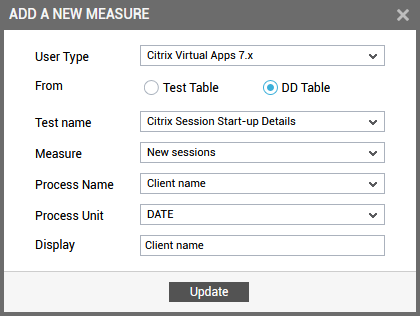
Figure 10 : Selecting a detailed measure for display in User Experience Dashboard
Now, specify the following in Figure 10:
- Select a test from the Test name list in Figure 9.
- All the measures that report detailed diagnosis will be populated in the Measures list. From this list, select the measure of your choice.
- All the detailed measures revealed by the detailed diagnosis of the chosen measure will be populated in the Process Name list. From this list, select the detailed measure that you wish to display in the User Experience Overview Dashboard.
- Then, choose the unit for the detailed measure that you have chosen.
- Also, choose the specify the display name of the detailed measure in the Display text box i.e., you can override the default name of the detailed measure and provide the name of your choice for the detailed measure chosen from the Process name list.
-
To add the measure, click the Update button in Figure 8. Likewise, you can add multiple measures of your choice for display in the User Experience Dashboard.
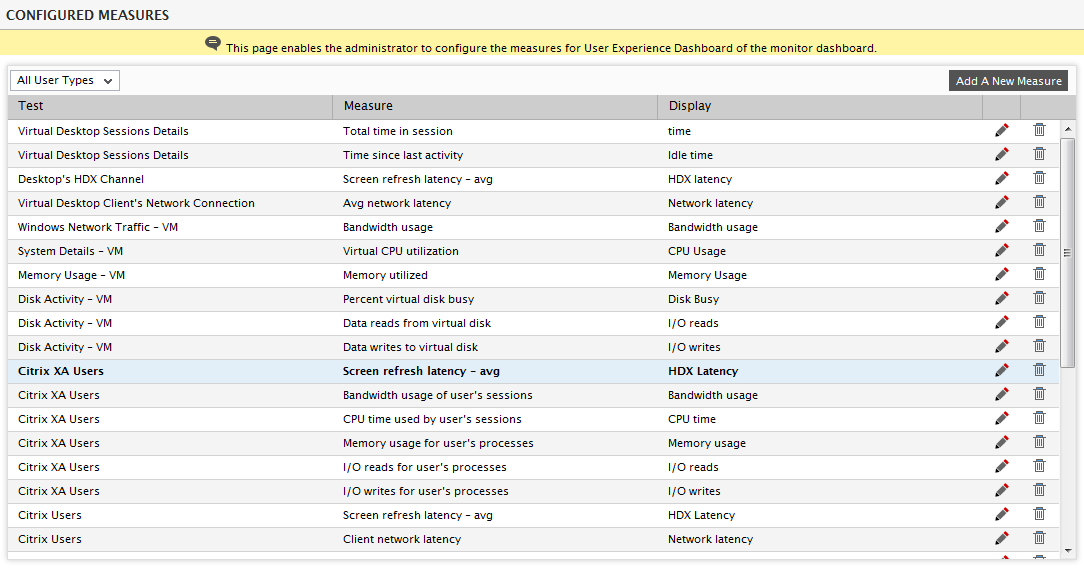
Figure 11 : Viewing the existing measures configured for the User Experience dashboard
- First select a user type from the User Type list of Figure 8.
-
You can view a pre-configured list of measures and their corresponding tests in the right panel of Figure 11. To delete any of the measures that pre-exist, click on the
 icon corresponding to that measure. To modify the display name of a pre-defined measure, you can click the
  icon against that particular Test/Measure combination. Figure 12 will then appear.
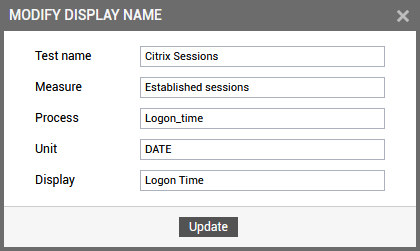
Figure 12 : Modifying the display name of a measure configured for the User Experience dashboard
- The Test name and the Measure text box will be auto populated when you click the icon in Figure 11. By default, the default display name of the detailed measure will be displayed in the Display text box. You can provide the display name of your choice in the Display text box and click the Update button to save the changes.
-
Using the Other Display Settings sub-node under the User Experience Dashboard (see Figure 13), you can customize the display of the User Experience Dashboard in the eG monitor interface of your environment.
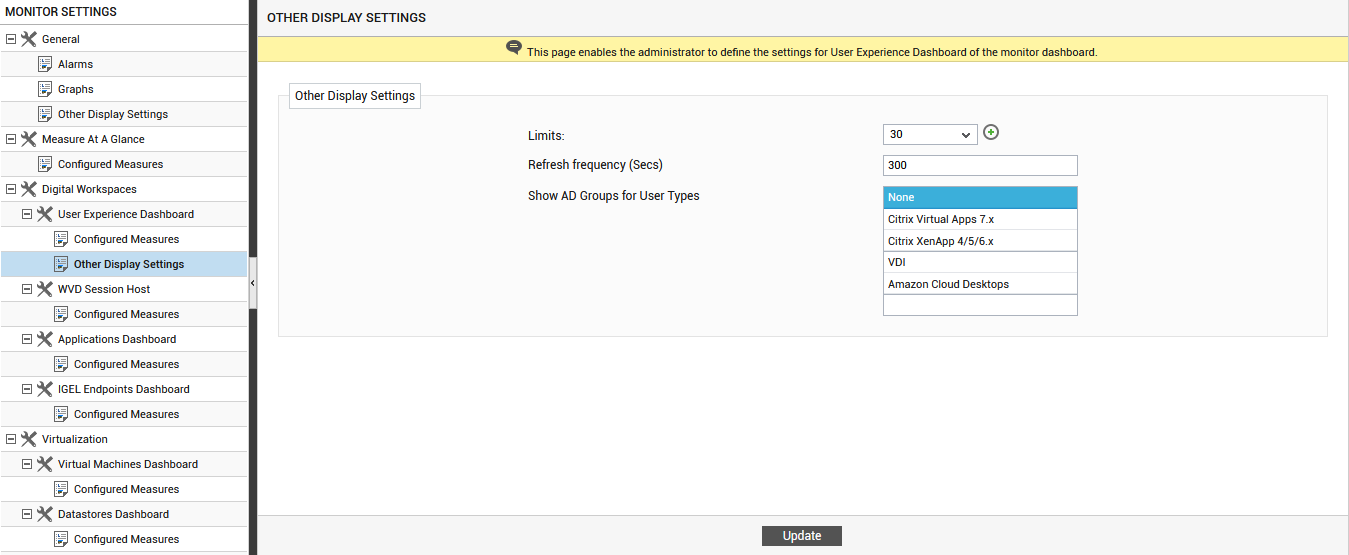
Figure 13 : Configuring other display settings of the User Experience dashboard
- By default, the User Experience Overview dashboard will list a maximum of 30 desktops/XenApp/Terminal servers in the monitored environment. If you wish to alter the maximum number of desktops/XenApp/Terminal servers that should be displayed in the overview dashboard, then you can set your own value using the Limits list.
- Specify the frequency (in seconds) at which the User Experience Dashboard should auto-refresh in the Refresh Frequency (Secs) text box. By default, this is 300 seconds.
- By default, the User Experience dashboard can be generated for users of VDI/XenApp/Terminal server environments. If the users of the VDI/XenAPP/Terminal servers are part of an Active Director group, then eG Enterprise can group such users/desktops in terms of the Active Directory Group in the User Experience Dashboard. To achieve this, a Show AD Groups for User Types list is provided (see Figure 13). If you select XenApp from this list, then the users logging into the XenApp server will be grouped based on the Active Directory groups and the User Experience dashboard will be displayed based on each Active Directory Group. By default, None will be selected from this list.
- Clicking the Update button in Figure 13 will register your changes.
Configuring the AVD Session Hosts Dashboard
To configure the measures which need to be highlighted in the AVD Dashboard, you can use the AVD Session Host node under the Digital Workspace node in the MONITOR SETTINGS tree-structure and its sub-nodes.
- First, expand the AVD Session Host node in the Digital Workspace node in the monitor settings tree in the left panel. Then, click the Configured Measures sub-node (see Figure 14).
-
The configured measures page will then appear in the right panel (see Figure 7).
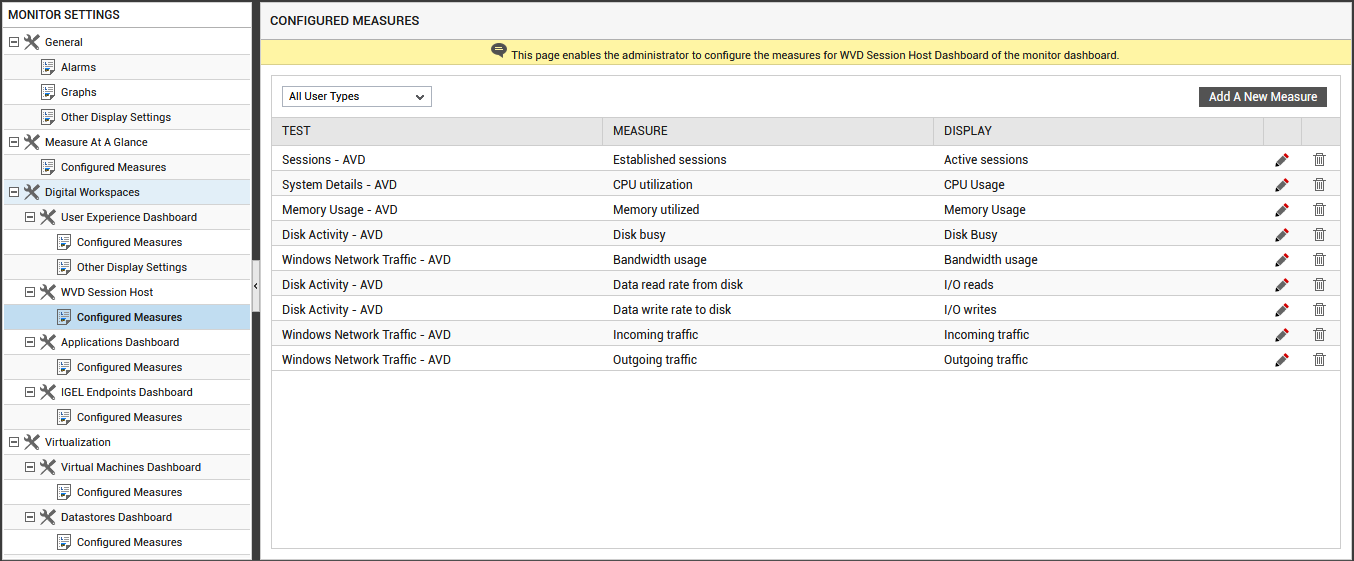
- You can configure the AVD Dashboard with a different set of measures for different types of users (i.e., Microsoft Azure Host Pool/Microsoft AVD Broker) in your environment. By default, the All User Types option (See Figure 14) is chosen from the list box indicating that the CONFIGURED MEASURES page displays the complete list of metrics pre-configured for display in the AVD Dashboard, irrespective of the types of users in your environment. If you wish to view the measures that are relevant only to your Microsoft Azure Host Pool/Microsoft AVD Broker, then you can select the appropriate option from the list box.
-
On the other hand, if you to wish to view the performance of a measure that is not pre-defined in this section, click on the Add New Measure button in Figure 14. An add a new measure pop up window will then appear (see Figure 15).
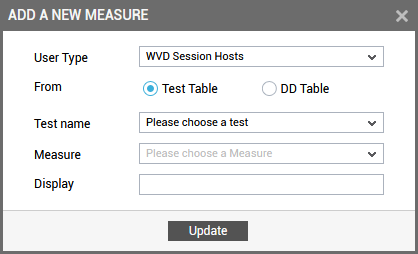
Figure 15 : Adding a new measure for display in the AVD Session Hosts dashboard
-
To add more measures, do the following:
- First select a user type from the User Type list of Figure 15.
Then, use the Test and DD options given against the From flag to add either a measure reported by a test or a detailed measure revealed by the detailed diagnosis of a measure. By default, Test is chosen against this flag (see Figure 15).
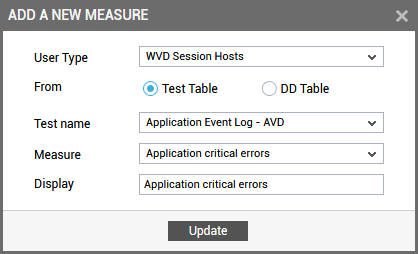
Figure 16 : Selecting test measure for display in the Performance of AVD Session Hosts dashboard
Now, specify the following in Figure 16:
- Select a test from the Test name list in Figure 16.
- All the measures that are reported by the chosen test will then you want to be populated in the Measures list.
- From this list, select the measure that should appear in the AVD Session Hosts dashboard.
- Then, specify the display name of the measure in the Display text box i.e., you can override the default name of the measure and provide the name of your choice for the chosen measure.
-
On the other hand, if you wish to display additional information that is a part of the detailed diagnosis of a measure, select DD option against the From flag.
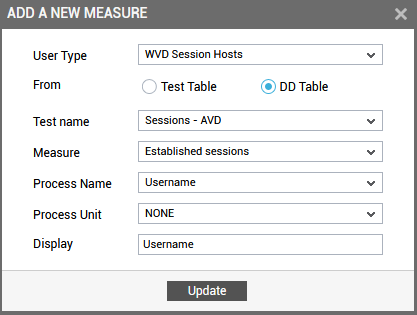
Figure 17 : Selecting a detailed measure for display in the Performance of AVD Session Hosts dashboard
Now, specify the following in Figure 17:
- Select a test from the Test name list.
- All the measures that report detailed diagnosis will be populated in the Measures list. From this list, select the measure of your choice.
- All the detailed measures revealed by the detailed diagnosis of the chosen measure will be populated in the Process Name list. From this list, select the detailed measure that you wish to display in the Performance of AVD Session Hosts dashboard.
- Then, choose the unit for the detailed measure
- Also, choose the specify the display name of the detailed measure in the Display text box i.e., you can override the default name of the detailed measure and provide the name of your choice for the detailed measure chosen from the Process name list.
-
To add the measure, click the Update button in Figure 17. Likewise, you can add multiple measures of your choice for display in the Performance of AVD Session Hosts dashboard.
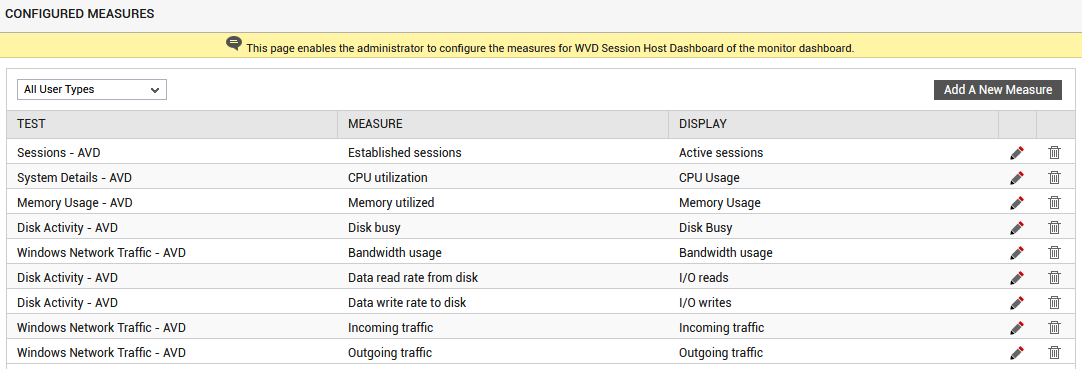
Figure 18 : Viewing the existing measures configured for the Performance of AVD Session Hosts dashboard
- First select a user type from the User Type list of Figure 15.
-
You can view a pre-configured list of measures and their corresponding tests in the right panel of Figure 18. To delete any of the measures that pre-exist, click on the
icon corresponding to that measure. To modify the display name of a pre-defined measure, you can click the icon against that particular Test/Measure combination. will then appear.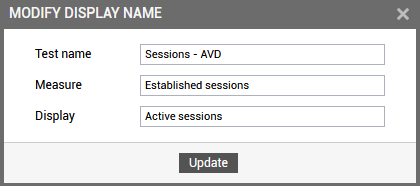
Figure 19 : Modifying the display name of a measure configured for the Performance of AVD Session Hosts dashboard
- The Test name and the Measure text box will be auto populated when you click the icon in Figure 18. By default, the default display name of the detailed measure will be displayed in the Display text box. You can provide the display name of your choice in the Display text box and click the Update button to save the changes.
- Clicking the Update button in will register your changes.
Configuring the Applications Dashboard
The Applications dashboard provided by the eG Enterprise helps end-users themselves to view the performance metrics related to their access to the applications in their infrastructure. To configure the measures which need to be highlighted in the Applications Dashboard, you can use the Applications Dashboard sub-node under Digital Workspace node in the MONITOR SETTINGS tree-structure and its sub-nodes.
- First, expand the Applications Dashboard node under the Digital Workspace node in the monitor settings tree in the left panel. Then, click the Configured Measures sub-node (see Figure 20).
-
The configured measures page will then appear in the right panel (see Figure 20).
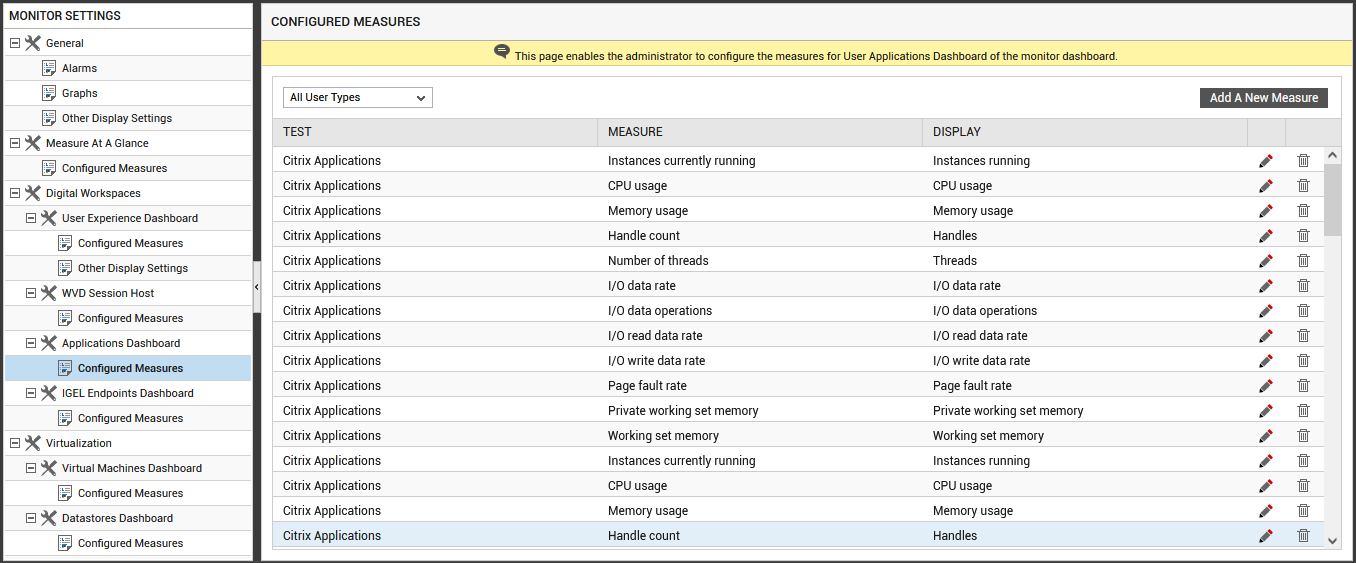
Figure 20 : The measures configured for Applications dashboard
- You can configure the Applications dashboard with a different set of measures for different types of users in your environment. By default, the All User Types option (see Figure 20) is chosen from the list box indicating that the CONFIGURED MEASURES page displays the complete list of metrics pre-configured for display in the Applications Dashboard, irrespective of the types of users in your environment. If you wish to view the measures that are relevant only to your applications, then you can select the appropriate option from the list box.
-
On the other hand, if you to wish to view the performance of a measure that is not pre-defined in this section, click on the Add New Measure button in Figure 20. An add a new measure pop up window will then appear (see Figure 21).
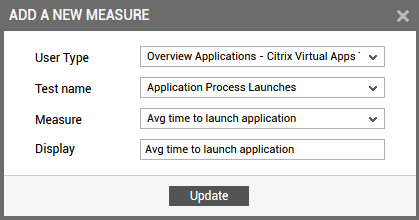
Figure 21 : Adding a new measure for display in the Applications dashboard
-
To add more measures to the Applications dashboard, do the following:
- First select a user type from the User Type list of Figure 21.
- Then, select a test from the Test name list in Figure 21.
- All the measures that are reported by the chosen test will then be populated in the Measures list.
- From this list, select the measure that should appear in the Applications dashboard.
- Then, specify the display name of the measure in the Display text box i.e., you can override the default name of the measure and provide the name of your choice for the chosen Measure.
-
To add the measure, click the Update button in Figure 21. Likewise, you can add multiple measures of your choice for display in the Applications dashboard.
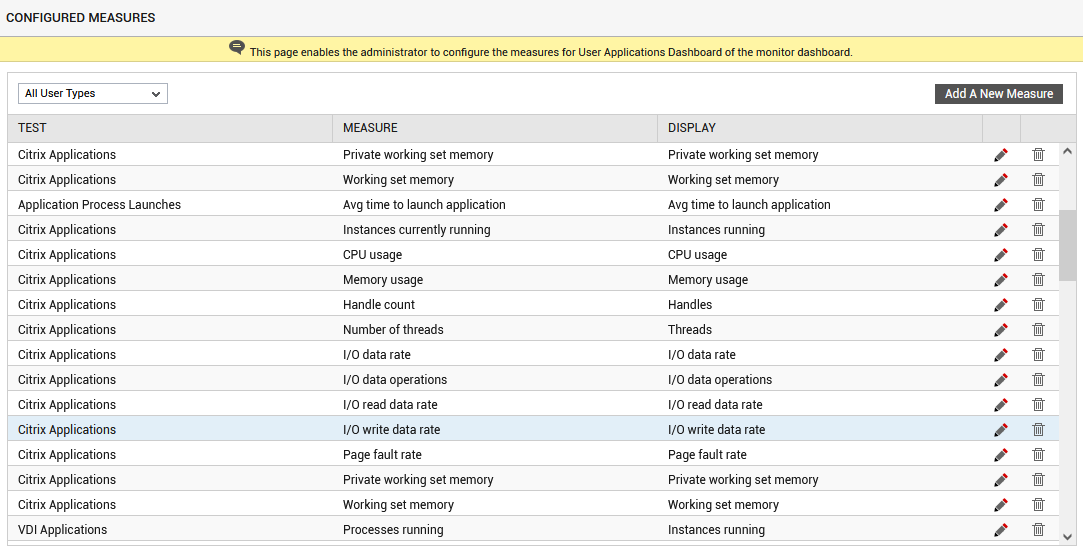
Figure 22 : Viewing the existing measures configured for the Applications dashboard
-
You can view a pre-configured list of measures and their corresponding tests in the right panel of Figure 22. To delete any of the measures that pre-exist, click on the
icon corresponding to that measure. To modify the display name of a pre-defined measure, you can click the icon against that particular Test/Measure combination. Figure 23 will then appear.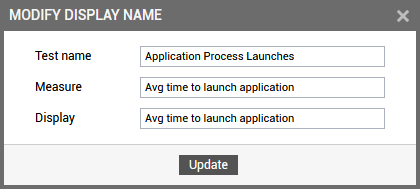
Figure 23 : Modifying the display name of a measure configured for the Applications dashboard
- The Test name and the Measure text box will be auto populated when you click the icon in Figure 22. By default, the default display name of the measure will be displayed in the Display text box. You can provide the display name of your choice in the Display text box and click the Update button to save the changes.
- Clicking the Update button in Figure 23 will register your changes.
Configuring the IGEL Endpoints Dashboard
The IGEL Endpoints dashboard provided by the eG Enterprise helps end-users themselves to view the performance metrics related to their access to the IGEL Endpoints in their infrastructure. To configure the measures which need to be highlighted in the IGEL Endpoints dashboard, you can use the IGEL Endpoints Dashboard node under the Digital Workspace node in the MONITOR SETTINGS tree-structure and its sub-nodes.
- First, expand the IGEL Endpoints Dashboard node under the Digital Workspace in the monitor settings tree in the left panel. Then, click the Configured Measures sub-node (see Figure 24).
-
The configured measures page will then appear in the right panel (see Figure 24).
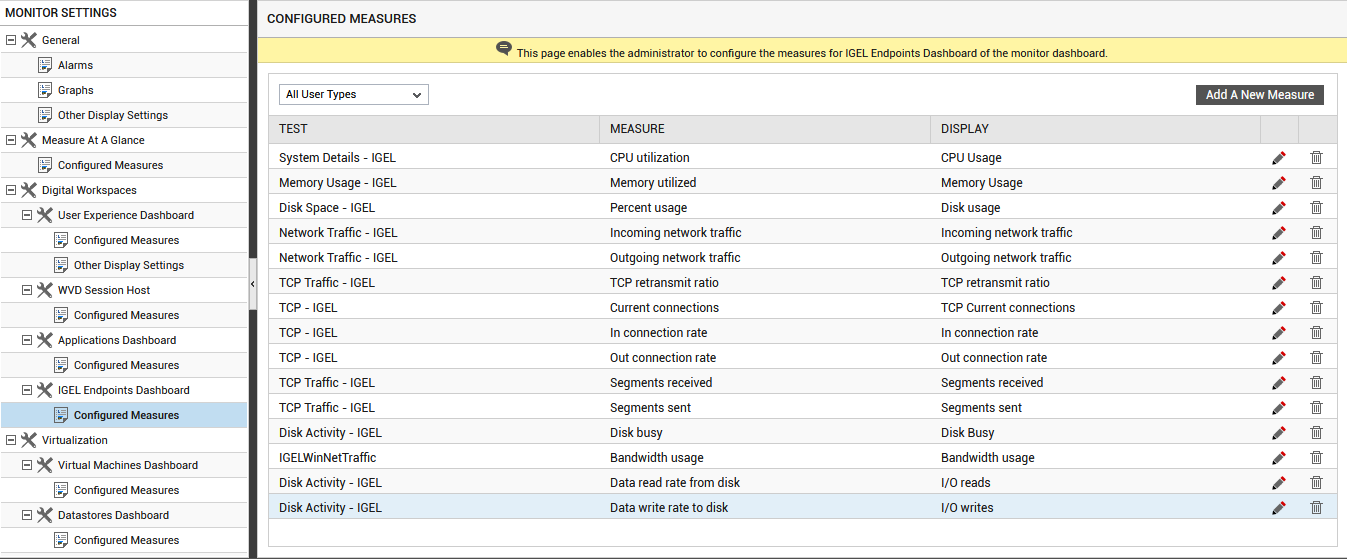
Figure 24 : The measures configured for IGEL Endpoints dashboard
- You can configure the IGEL Endpoints dashboard with a different set of measures for different types of users in your environment. By default, the All User Types option (see Figure 24) is chosen from the list box indicating that the CONFIGURED MEASURES page displays the complete list of metrics pre-configured for display in the IGEL Endpoints dashboard, irrespective of the types of users in your environment. If you wish to view the measures that are relevant only to your endpoints, then you can select the appropriate option from the list box.
-
On the other hand, if you to wish to view the performance of a measure that is not pre-defined in this section, click on the Add New Measure button in Figure 24. An add a new measure pop up window will then appear (see Figure 25).
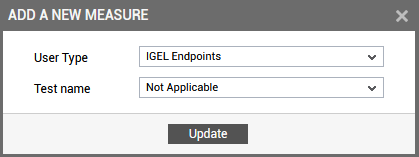
Figure 25 : Adding a new measure for display in the IGEL Endpoints dashboard
-
To add more measures to the IGEL Endpoints dashboard, do the following:
- First select a user type from the User Type list of Figure 25.
- Then, select a test from the Test name list in Figure 25.
- All the measures that are reported by the chosen test will then be populated in the Measures list.
- From this list, select the measure that should appear in the IGEL Endpoints dashboard.
- Then, specify the display name of the measure in the Display text box i.e., you can override the default name of the measure and provide the name of your choice for the chosen Measure.
-
To add the measure, click the Update button in Figure 25. Likewise, you can add multiple measures of your choice for display in the IGEL Endpoints dashboard.
Figure 26 : Viewing the existing measures configured for the IGEL Endpoints dashboard
-
You can view a pre-configured list of measures and their corresponding tests in the right panel of Figure 26. To delete any of the measures that pre-exist, click on the
icon corresponding to that measure. To modify the display name of a pre-defined measure, you can click the icon against that particular Test/Measure combination. Figure 27 will then appear.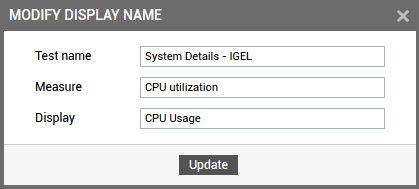
Figure 27 : Modifying the display name of a measure configured for the IGEL Endpoints dashboard
- The Test name and the Measure text box will be auto populated when you click the icon in Figure 27. By default, the default display name of the measure will be displayed in the Display text box. You can provide the display name of your choice in the Display text box and click the Update button to save the changes.
- Clicking the Update button in Figure 27 will register your changes.
Configuring the Virtual Machines Dashboard
The Virtual Machines dashboard provided by the eG Enterprise helps end-users themselves to view the performance metrics related to resource utilization, connectivity and traffic to the virtual machines in their infrastructure. To configure the measures which need to be highlighted in the Virtual Machines dashboard, you can use the Virtual Machines Dashboard sub-node under Virtualizations node in the MONITOR SETTINGS tree-structure and its sub-nodes.
- First, expand the Virtual Machines Dashboard node under the Virtualizations node in the monitor settings tree in the left panel. Then, click the Configured Measures sub-node (see Figure 28).
-
The configured measures page will then appear in the right panel (see Figure 7).
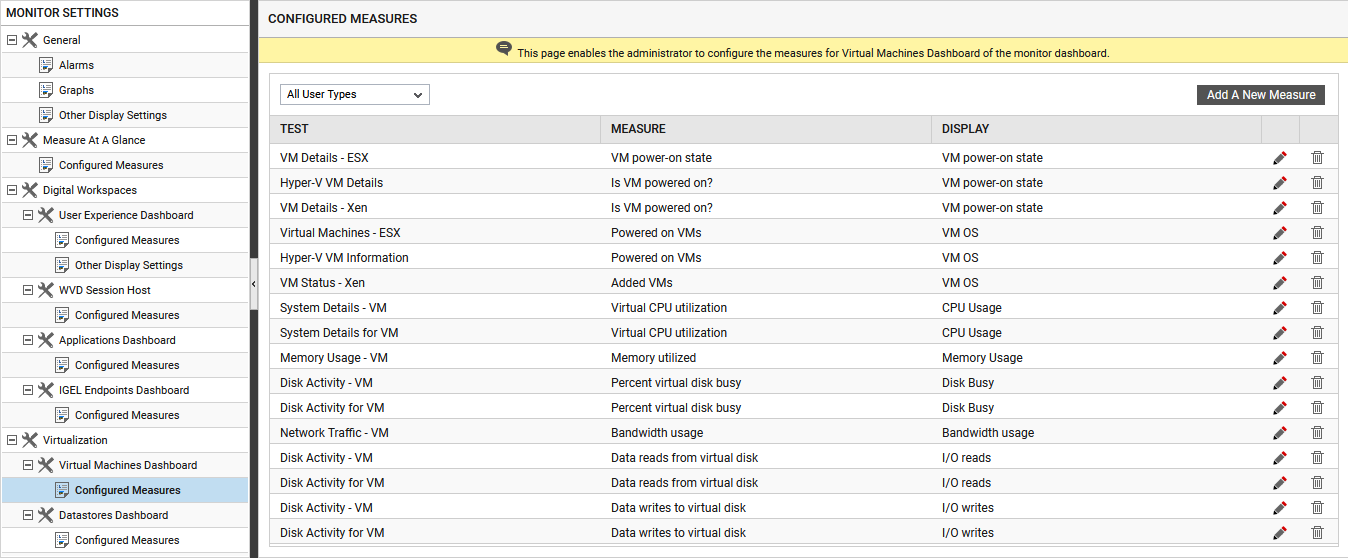
Figure 28 : The measures configured for Virtual Machines dashboard
- You can configure the Virtual Machines dashboard with a different set of measures for different types of users in your environment. By default, the All User Types option (see Figure 28) is chosen from the list box indicating that the CONFIGURED MEASURES page displays the complete list of metrics pre-configured for display in the Virtual Machines dashboard, irrespective of the types of users in your environment. If you wish to view the measures that are relevant only to your virtual machines, then you can select the appropriate option from the list box.
-
On the other hand, if you to wish to view the performance of a measure that is not pre-defined in this section, click on the Add New Measure button in Figure 28. An add a new measure pop up window will then appear (see Figure 8).
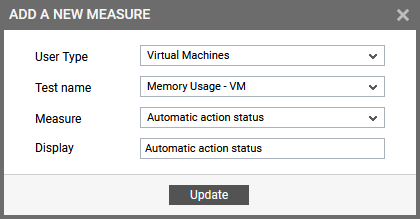
Figure 29 : Adding a new measure for display in the Virtual Machines dashboard
-
To add more measures to the Virtual Machines dashboard, do the following:
- First select a user type from the User Type list of Figure 29.
- Then, select a test from the Test name list in Figure 29.
- All the measures that are reported by the chosen test will then be populated in the Measures list.
- From this list, select the measure that should appear in the Virtual Machines dashboard.
- Then, specify the display name of the measure in the Display text box i.e., you can override the default name of the measure and provide the name of your choice for the chosen Measure.
-
To add the measure, click the Update button in Figure 29. Likewise, you can add multiple measures of your choice for display in the Virtual Machines dashboard.
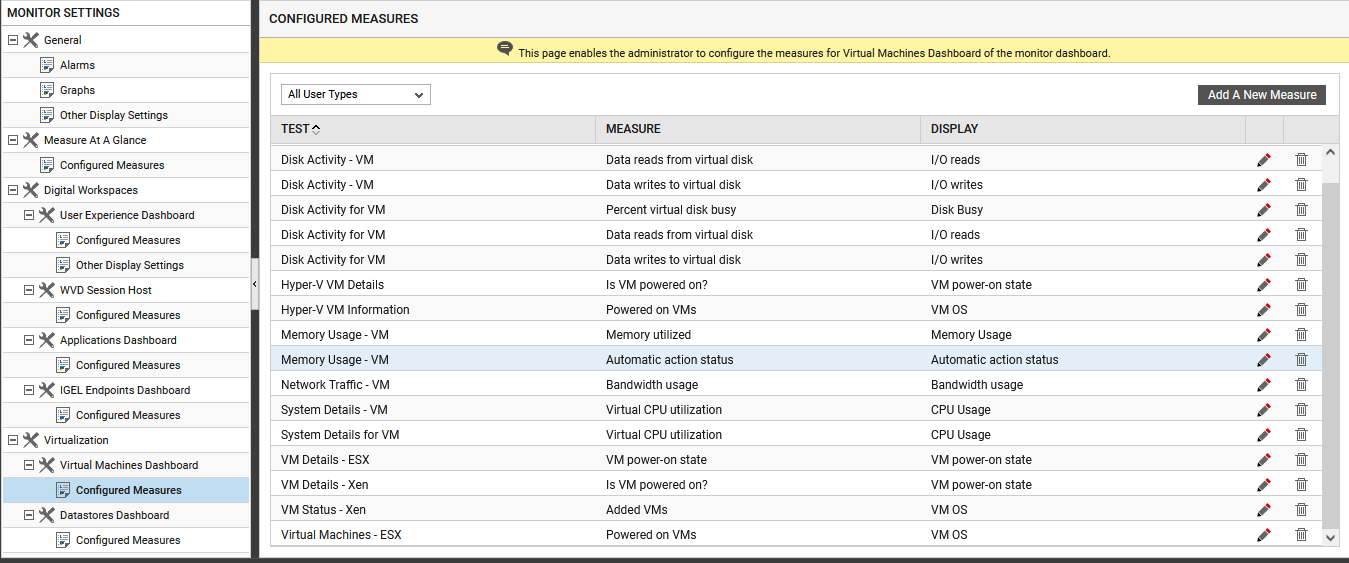
Figure 30 : Viewing the existing measures configured for the Virtual Machines dashboard
-
You can view a pre-configured list of measures and their corresponding tests in the right panel of Figure 30. To delete any of the measures that pre-exist, click on the
icon corresponding to that measure. To modify the display name of a pre-defined measure, you can click the icon against that particular Test/Measure combination. Figure 31 will then appear.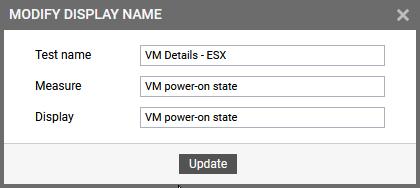
Figure 31 : Modifying the display name of a measure configured for the Virtual Machines dashboard
- The Test name and the Measure text box will be auto populated when you click the icon in Figure 31. By default, the default display name of the measure will be displayed in the Display text box. You can provide the display name of your choice in the Display text box and click the Update button to save the changes.
- Clicking the Update button in Figure 31 will register your changes.
Configuring the Datastores Dashboard
The Datastores dashboard provided by the eG Enterprise helps end-users themselves to view the performance metrics related to resource utilization, connectivity and traffic to the virtual machines in their infrastructure. To configure the measures which need to be highlighted in the Datastores dashboard, you can use the Datastores Dashboard sub-node under Virtualizations node in the MONITOR SETTINGS tree-structure and its sub-nodes.
- First, expand the Datastores Dashboard node under the Virtualizations node in the monitor settings tree in the left panel. Then, click the Configured Measures sub-node (see Figure 28).
-
The configured measures page will then appear in the right panel (see Figure 7).
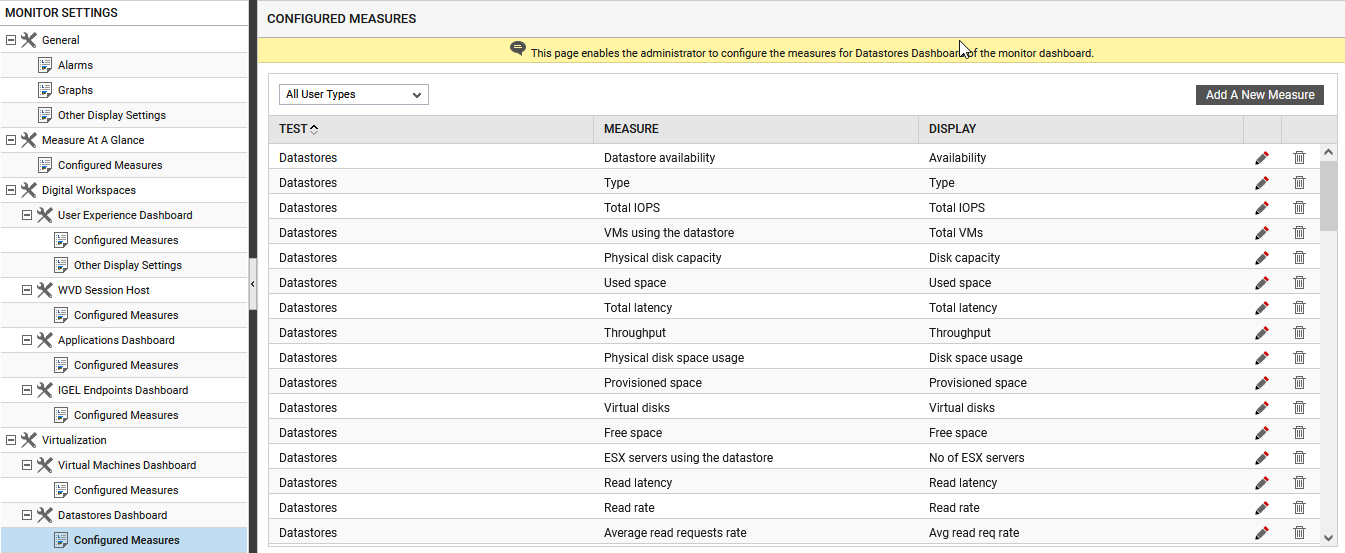
Figure 32 : The measures configured for Datastores dashboard
- You can configure the Datastores dashboard with a different set of measures for different types of users in your environment. By default, the All User Types option (see Figure 32) is chosen from the list box indicating that the CONFIGURED MEASURES page displays the complete list of metrics pre-configured for display in the Datastores dashboard, irrespective of the types of users in your environment. If you wish to view the measures that are relevant only to your datastores, then you can select the appropriate option from the list box.
-
On the other hand, if you to wish to view the performance of a measure that is not pre-defined in this section, click on the Add New Measure button in Figure 32. An add a new measure pop up window will then appear (see Figure 33).
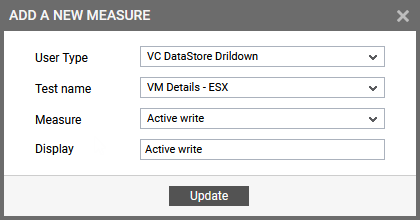
Figure 33 : Adding a new measure for display in the Datastores dashboard
-
To add more measures to the Datastores dashboard, do the following:
- First select a user type from the User Type list of Figure 33.
- Then, select a test from the Test name list in Figure 33.
- All the measures that are reported by the chosen test will then be populated in the Measures list.
- From this list, select the measure that should appear in the Datastores dashboard.
- Then, specify the display name of the measure in the Display text box i.e., you can override the default name of the measure and provide the name of your choice for the chosen Measure.
-
To add the measure, click the Update button in Figure 33. Likewise, you can add multiple measures of your choice for display in the Datastores dashboard.
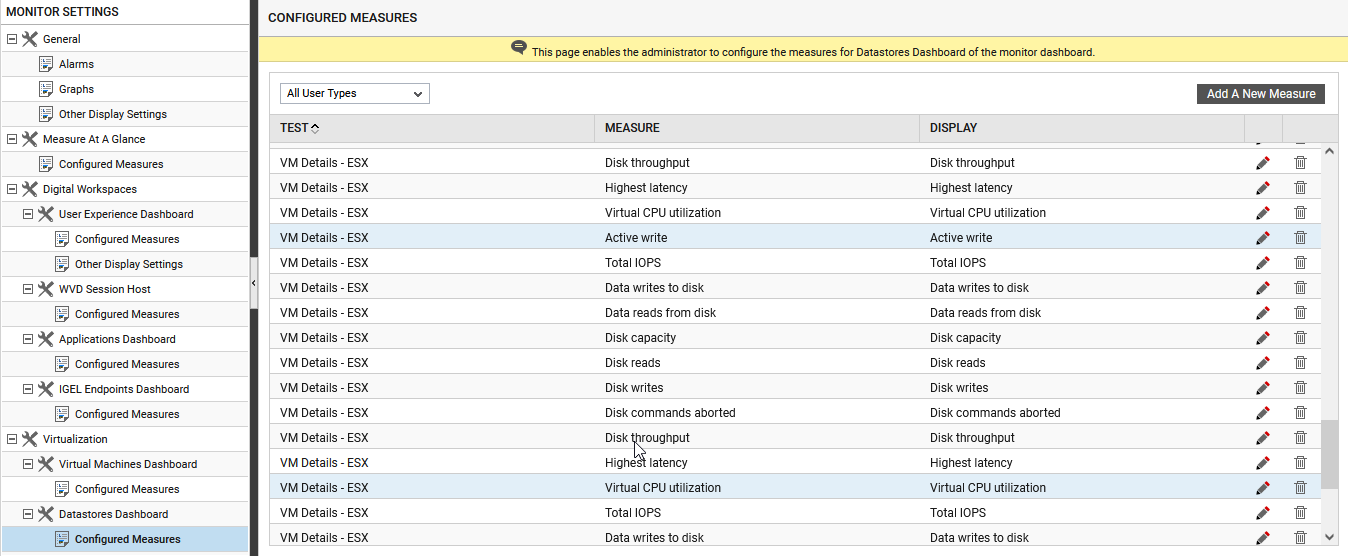
Figure 34 : Viewing the existing measures configured for the Datastores dashboard
-
You can view a pre-configured list of measures and their corresponding tests in the right panel of Figure 34. To delete any of the measures that pre-exist, click on the
icon corresponding to that measure. To modify the display name of a pre-defined measure, you can click the icon against that particular Test/Measure combination. Figure 35 will then appear.
Figure 35 : Modifying the display name of a measure configured for the Datastores dashboard
- The Test name and the Measure text box will be auto populated when you click the icon in Figure 35. By default, the default display name of the measure will be displayed in the Display text box. You can provide the display name of your choice in the Display text box and click the Update button to save the changes.
- Clicking the Update button in Figure 35 will register your changes.
-
Using the Other Display Settings sub-node under the Datastores Dashboard (see Figure 36), you can customize the display of the Datastores dashboard in the eG monitor interface of your environment.
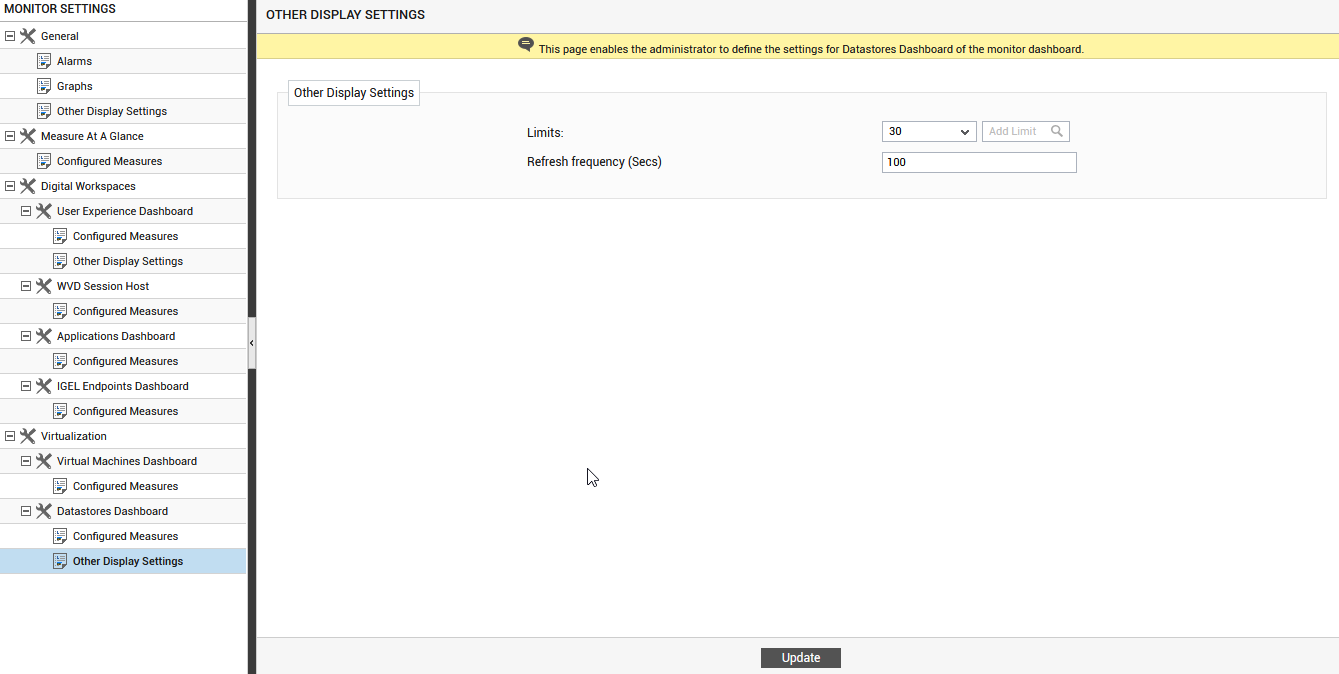
Figure 36 : Configuring other display settings of the Datastores dashboard
- By default, the Datastores dashboard will list a maximum of 30 datastores in the monitored environment. If you wish to alter the maximum number of datastores that should be displayed in the overview dashboard, then you can either choose your own value from the Limits list or you can add a new limit by using the
 icon that is given adjacent to the Limits list.
 - Specify the frequency (in seconds) at which the Datastores dashboard should auto-refresh in the Refresh Frequency (Secs) text box. By default, this is 100 seconds.