How to Configure Thresholds?
The broad steps for configuring thresholds are as follows:
- Figure out whether you want to override the default thresholds or configure component-specific thresholds;
- Define thresholds for every measure of the test, depending upon the type of thresholds suitable for each measure;
Each of these broad steps are dealt with elaborately in the sections that follow.
Choosing Between Default and Specific Thresholds
Default thresholds typically apply to all components of a chosen type. So, choose the Test option from the Default sub-menu of the Thresholds menu in the Alerts tile, only if you want your threshold settings to be shared by all components of a type. In this case, Figure 1 will appear.
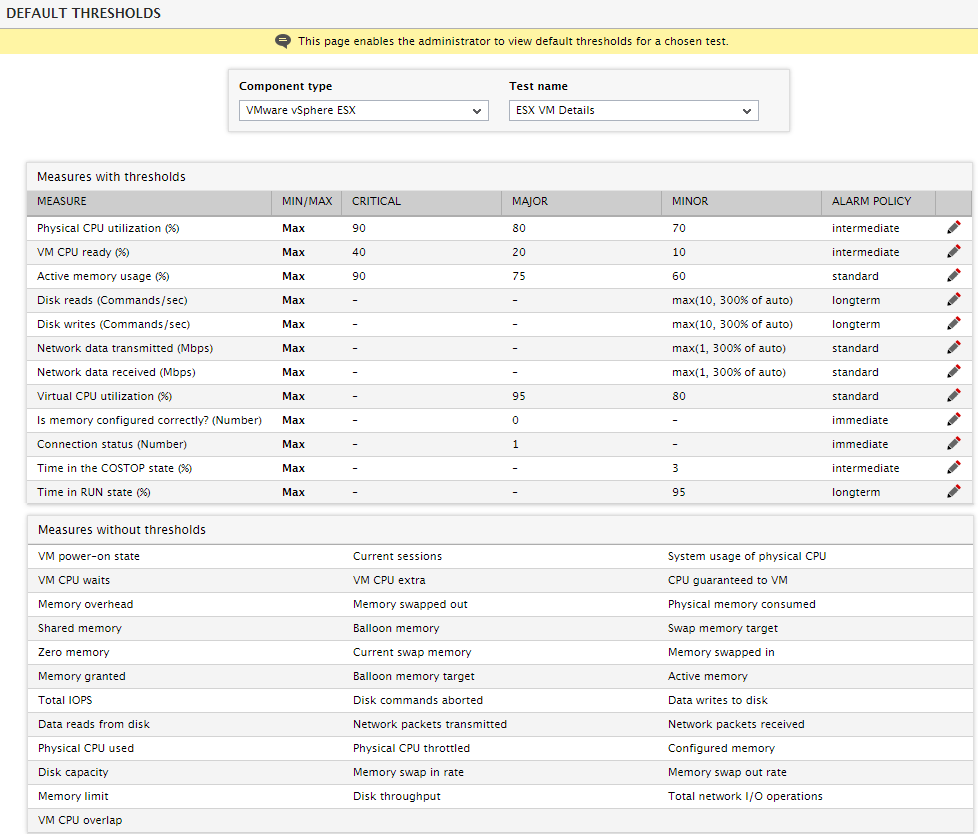
Figure 1 : The DEFAULT THRESHOLDS page
From Figure 1, select the Component type to which the default thresholds apply and then pick the Test name for which the default thresholds need to be configured. All measures related to the chosen test will then be listed. While some measures of a test may be pre-configured with thresholds, some may not be associated with any thresholds at all. Accordingly, the measure list in Figure 1 will be split into two sections – Measures with thresholds and Measures without thresholds. Each measure in the Measures with thresholds section will be accompanied by its current threshold configuration and alarm policy setting. You can change these configurations by clicking the  icon corresponding to a measure in Figure 1. If you want to define thresholds for a measure in the Measures without thresholds section, simply click on that measure name in that section.
Note:
-
Changes made to the default thresholds of a test will automatically apply to all component types with which that test is associated. Therefore, exercise caution while making changes to these threshold settings.
-
Default thresholds, once configured, will take 24 hours to take effect.
The default thresholds set for a test will automatically apply to all descriptors supported by the test. Sometimes however, administrators may want to define the same threshold values for a group of closely-related descriptors. For instance, consider a virtualized environment where the first three letters of the VM name represent the operating system of the VM – lin for Linux VMs, win for Windows VMs and so on. In such an environment, the administrator may want to configure the same upper and lower bounds of performance for the ESX VM Details test of all the Windows VMs alone – i.e., for all VMs with names that begin with win. To achieve this, the administrator can quickly define a descriptor pattern that groups all VMs that begin with win and can configure thresholds for that pattern, so that the threshold settings govern all those descriptors that match the configured pattern – in this case, the Windows VMs.
For defining a descriptor pattern and configuring its default thresholds, select the Descriptor option from the Default sub-menu of the Thresholds menu in the Alerts tile. This will open Figure 2. If descriptor patterns have already been defined and their thresholds configured, Figure 2 will list these patterns. You can modify the threshold configuration of any of the existing patterns by clicking the  button that corresponds to that pattern, or click the
  button to remove a pattern and its threshold specifications.
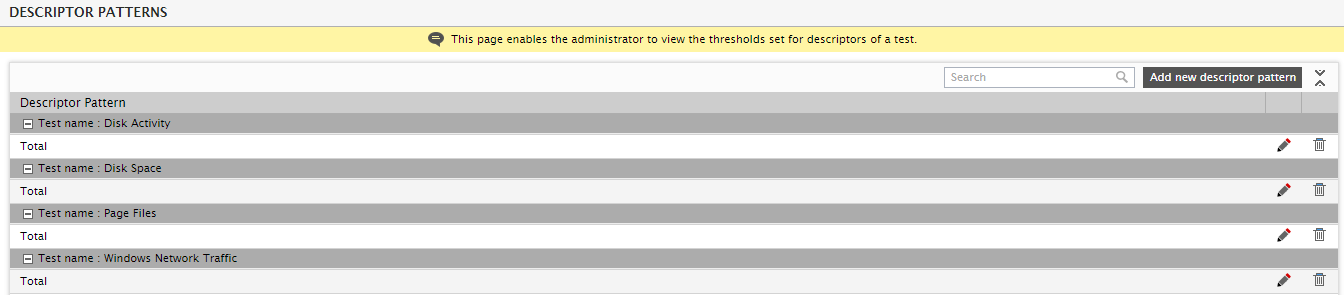
Figure 2 : List of descriptor patterns that pre-exist
To add a new pattern, click the Add new descriptor pattern button in Figure 2. This will open Figure 3. In Figure 3, enter the Descriptor pattern. The pattern can be an expression of the form *expr* or expr or *expr or expr*. A leading '*' signifies any number of leading characters, while a trailing '*' signifies any number of trailing characters. In the case of our example, the descriptor pattern should look for VM names that begin with the string, win;so, enter win* in the Descriptor pattern text box. Then, click the icon corresponding to a measure in Measures with thresholds section of Figure 3 to change the threshold settings of that measure for a descriptor pattern. If you want to define thresholds for a measure in the Measures without thresholds section, simply click on that measure name in that section. Finally, click the Update button in Figure 3.
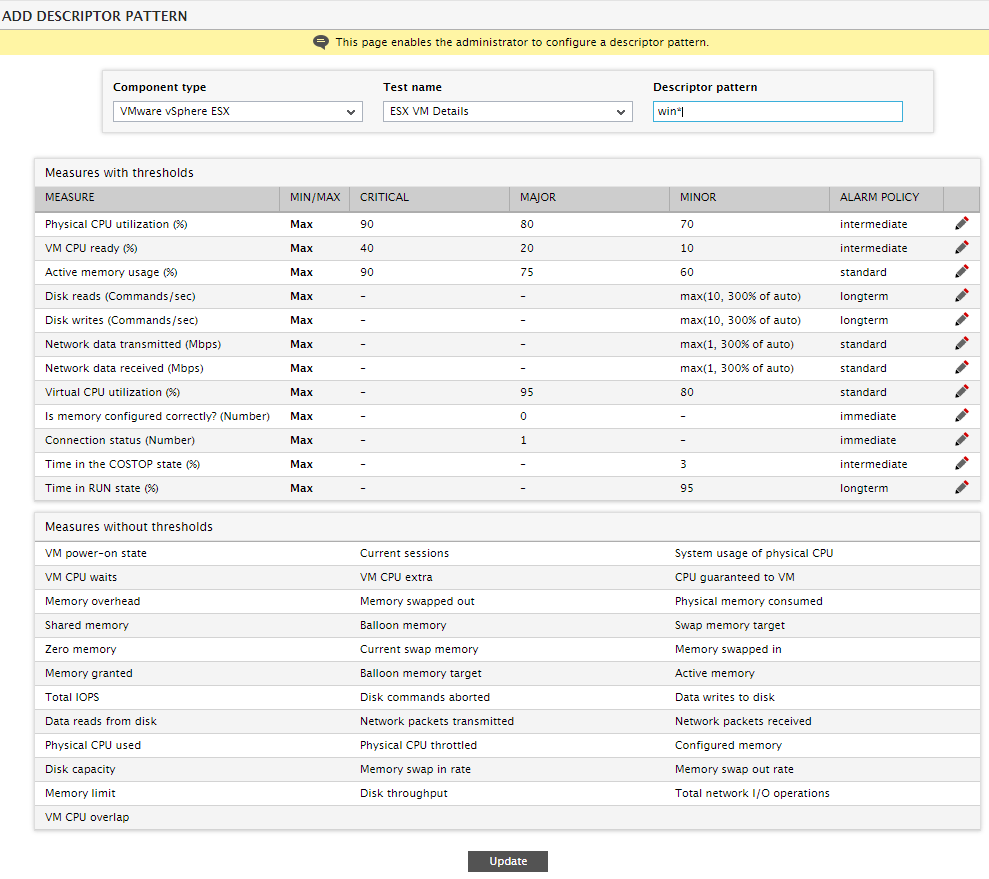
Figure 3 : Configuring default thresholds for a descriptor pattern
Note:
Changes made to the default thresholds of a descriptor pattern will automatically apply to all component types with which the chosen test is associated and reports measures for a descriptor that matches the specified pattern. Therefore, exercise caution while making changes to these threshold settings.
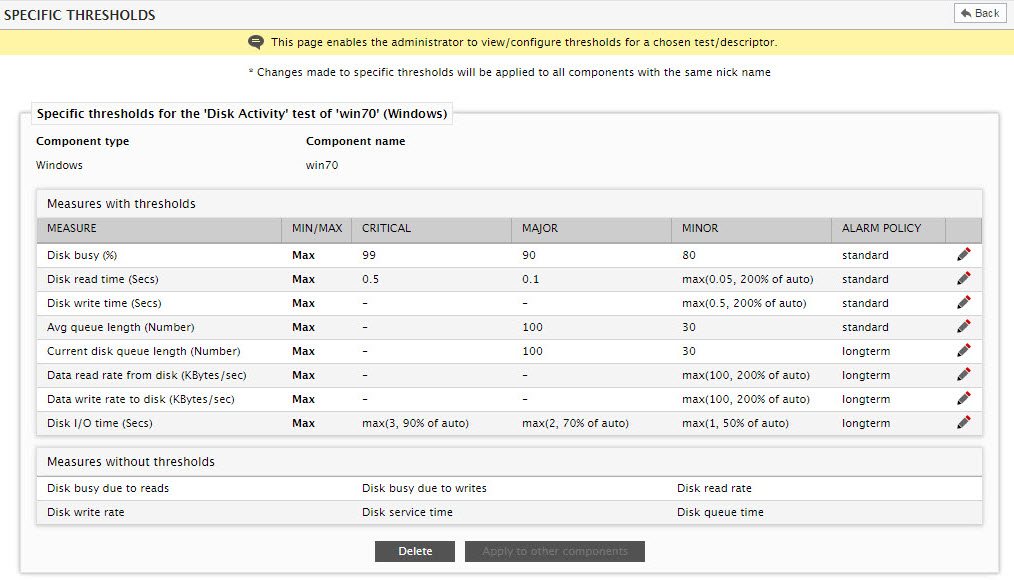
Specific thresholds on the other hand apply to a chosen component only. To configure those thresholds that will govern the state of a particular component alone, select the Component option from the Thresholds menu of the Alerts tile. Figure 4 will appear in this case.
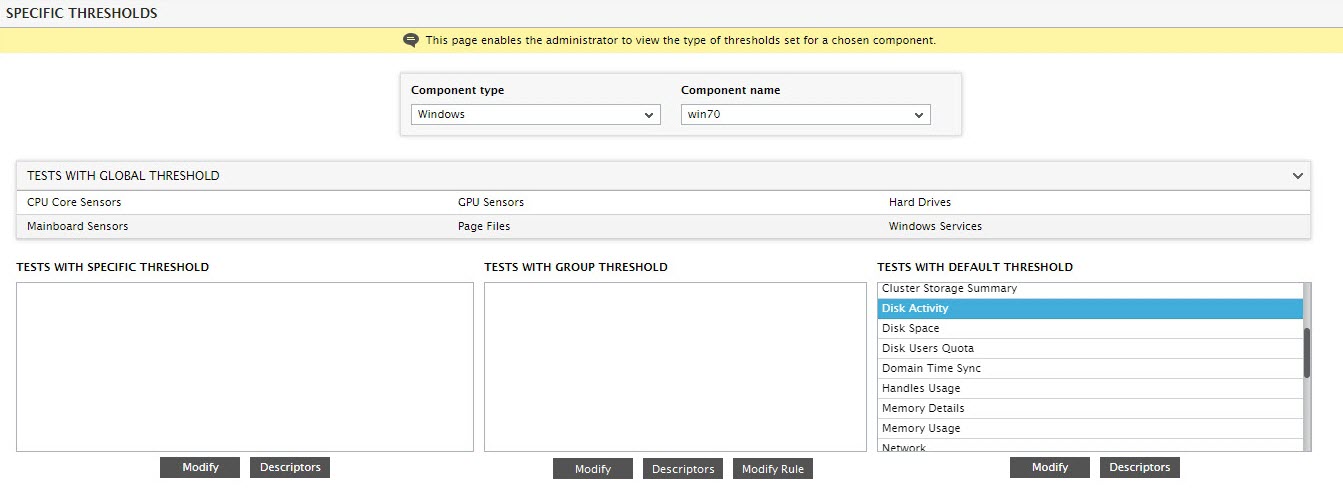
Figure 4 : The SPECIFIC THRESHOLDS page
From Figure 4, select the Component type and then the specific Component name for which thresholds are to be configured. If global thresholds apply to any tests mapped to the chosen component, such tests will be listed in the tests with global threshold section. To alter the threshold configuration of such tests, click on the test name in the tests with global threshold section. This will allow you to modify the default thresholds of that test. To know more about global thresholds, refer to Global Thresholds of this document.
Default thresholds will apply to all tests of a component, until specific thresholds are explicitly configured for one/more tests of that component. This is why, if a component is chosen for threshold configuration for the very first time from the Component name list of Figure 4, all tests mapped to that component will by default appear in the tests with default threshold list box of Figure 9.4. To configure component-specific thresholds for a test in this list box, select the test and click the Modify button. Figure 5 will appear, which will list the measures reported by that test. While some measures of a test may be pre-configured with thresholds, some may not be associated with any thresholds at all. Accordingly, the measure list in Figure 5 will be split into two sections – Measures with thresholds and Measures without thresholds.
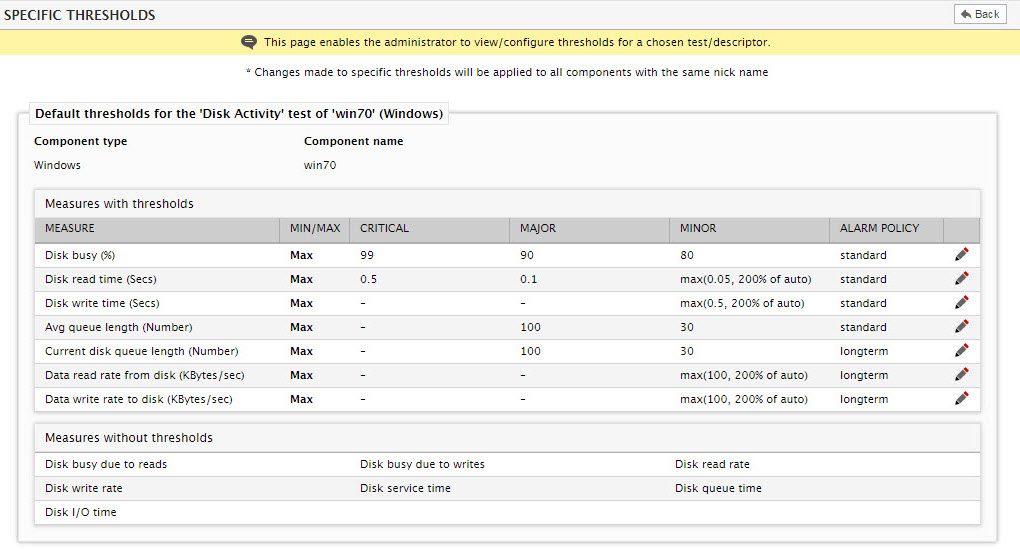
Figure 5 : Configuring specific thresholds for a test mapped to a component
Each measure in the Measures with thresholds section will be accompanied by its current threshold configuration and alarm policy setting. You can change these configurations by clicking the icon corresponding to a measure in Figure 5. If you want to define thresholds for a measure in the Measures without thresholds section, simply click on that measure name in that section.
Note:
Changes made to the threshold settings of a test for a specific component will automatically apply to all those components with the same nick name as that component and to which the chosen test is mapped. Therefore, exercise caution while making changes to these threshold settings.
If you click on the Descriptors button in Figure 5 after selecting a test from the tests with default threshold list box, a separate Descriptors with component threshold settings will automatically pop up as depicted by Figure 6. This section will display all descriptors that are currently active for the chosen component-test combination. To configure component-specific thresholds for a descriptor, click on that descriptor in Figure 6.

Figure 6 : Viewing descriptors of a test
Figure 7 will appear revealing the default threshold configuration of each measure reported for that descriptor. Here again, you can click the icon corresponding to a measure in the Measures with thresholds section to change that measure’s threshold configuration. Similarly, you can click on a measure name in the Measures without thresholds section of Figure 7 to configure descriptor-specific thresholds for it.
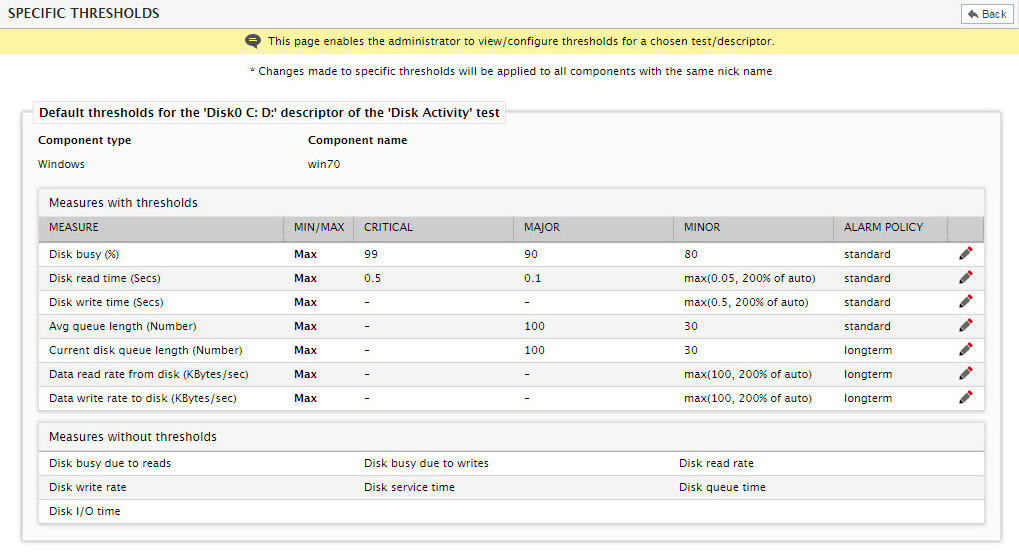
Figure 7 : Viewing the default threshold configuration of the measures of a descriptor related to a specific component
Note:
You can also choose not to compute thresholds for specific descriptors of a test - for instance, you might not want to compute thresholds for the "all" descriptor of the Event Log Test, and say, the "word" and "excel" descriptors of Processes Test. In order to achieve this, do the following:
- Edit the eg_tests.ini file in the <EG_INSTALL_DIR>\manager\config directory.
-
In the [nothreshold_descriptors] section of the file, provide the descriptors to be disabled during threshold computation, in the following format:
[NOTHRESHOLD_DESCRIPTORS]
ProcessTest=word,excel
EventLogTest=all - Finally, save the eg_tests.ini file.
-
Once this is done, the next time you attempt to modify the threshold definition for Processes test for a specific component, the Descriptors with component threshold settings section of Figure 6 will not display the "word" or the "excel" descriptors. Similarly, for the Event Log test, the "all" descriptor will not be listed in the Descriptors with component threshold settings section. You are thus prevented from setting thresholds for these descriptors. However, if default thresholds or component-level thresholds (as the case may be) are configured for the test, such thresholds will continue to be applied to the excluded descriptors, and they will continue to appear in the monitor interface.
If specific thresholds have already been configured for one/more tests mapped to the selected component, then such tests will be listed in the tests with specific thresholds list box of Figure 4. To make further changes to the specific threshold settings of any of these tests, select the test from the tests with specific threshold list box and click the Modify button. If you want to make changes to the thresholds of the descriptors of any of these tests, just select the test from the tests with specific threshold list box and click the Descriptors list.
Thresholds can also be configured and applied for a group of components. If such group thresholds apply to the chosen component, then all tests governed by these group thresholds will be listed in the tests with group threshold list box of Figure 4. You can modify these group threshold settings for a specific test alone by selecting a test from this list box and clicking the Modify button below it. Once you modify the thresholds set for a test from this list, then the test will automatically move to the TESTS WITH SPECIFIC THRESHOLDS list i.e., specific thresholds will take precedence over the group threshold set for the test. If you wish to modify the Threshold rule governing the chosen test alone, then you can click the Modify Rule button. If you want to make changes to the thresholds of the descriptors of any of the tests listed in the TESTS WITH GROUP THRESHOLD list box, just select the test from the list and click the Descriptors list.
Note:
If threshold configuration is changed on the eG manager, then it would take approximately one hour for the eG agent to download and apply the changes. Changes to Global Thresholds however will be applied immediately.
Defining the Thresholds of a Measure
Once you decide for what you want to define thresholds – whether it is for a component-type (default thresholds), a specific component (specific thresholds), a descriptor (descriptor thresholds), or a descriptor pattern – and select the test for which thresholds are to be defined, proceed to configure the upper and lower limits of performance for every measure of that test. The procedure for the same is as follows:
-
To define thresholds for any measure listed in the Measures with thresholds section of the default thresholds (see Figure 1), specific thresholds (see Figure 4), or the descriptor thresholds page (see Figure 3 or Figure 7), first click on the
icon corresponding to that measure. To define thresholds for a measure listed in the Measures without thresholds section of these web pages, simply click on the measure name. For instance, let us take the case of the Free memory measure reported by the System Details test. By default, no thresholds are set for this measure. Clicking on the measure name will hence lead you to Figure 8 below. 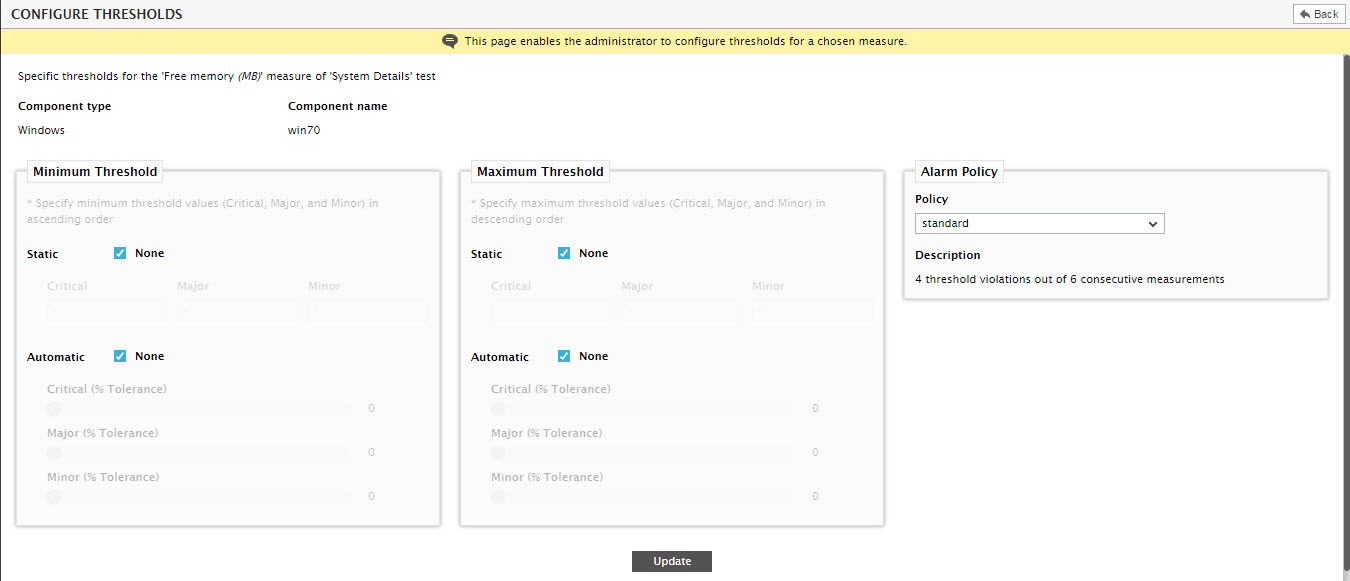
-
As can be inferred from Figure 8, the Free memory measure has no Minimum Threshold; nor a Maximum Threshold. Accordingly, the None check box is selected against Static and Automatic in both the Minimum Threshold and Maximum Threshold sections.
In the real world, any Windows/Unix host should have adequate free memory at all times. Excessive memory consumption by a host can often lead to the erosion of free memory, thus causing the performance of the host to degrade with time. This is why, if the amount of free memory on a host starts dwindling, it is a problem condition that should be brought to the attention of the administrator. To enable the eG Enterprise system to register a drop in the amount of free memory on a host as an ‘abnormality’, a Minimum Threshold will have to be set for the Free memory measure. A Minimum Threshold is violated when the actual value of a measure falls below the configured threshold value. Hence, it is only appropriate that we set a Minimum Threshold for the Free memory measure.
-
The first step to setting a Minimum Threshold is to indicate the type of threshold that should be set – static? automatic? or auto-static?. A Static Minimum Threshold should be configured with absolute/fixed values, and is hence, ideal for environments where load does not vary with time. To configure a Static Minimum Threshold, first deselect the None check box against Static in the Minimum Threshold section (see Figure 9).
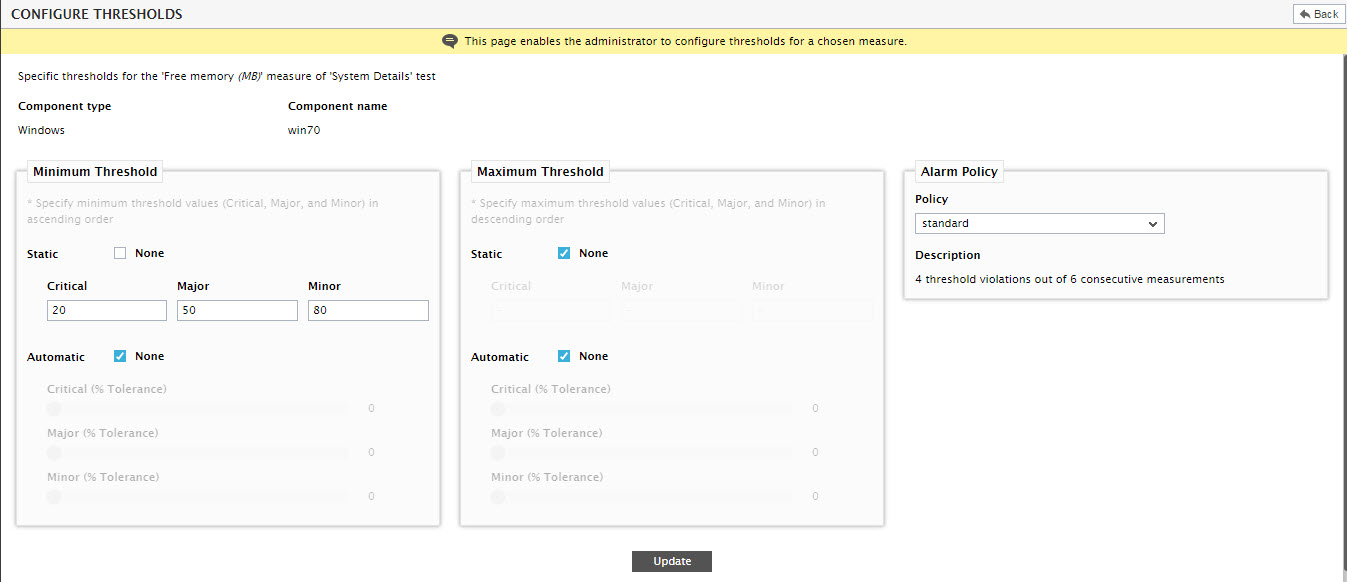
Figure 9 : Configuring a Static Minimum Threshold for the Free memory measure
- Multiple levels of Static thresholds need to be set – one each for every alarm priority (Critical, Major, and Minor). Therefore, specify a value (in MB) in the Critical, Major, and Minor text boxes in Figure 9. Also, note that the Minimum Threshold specifications should be in the ascending order. In other words, the Critical threshold should be configured with the lowest value and the Minor threshold with the highest value. This ensures that the eG Enterprise system sends out a Minor alert when the Free memory dips slightly, a Major alert when it falls a little more, and a Critical alert when Free memory falls steeply. Also, if you so need, you can even skip threshold levels – i.e., you need not specify threshold values for all the three (Critical/Major/Minor) levels; if required, you can omit threshold specifications for one/two levels.
- Now that the Static Minimum Threshold has been set for the Free memory measure, click the Update button to register the changes.
-
Instead of manually specifying the thresholds, you can also configure the eG Enterprise system to automatically compute the thresholds for Free memory. Automatic threshold computation is ideal for environments in which load is dynamic, owing to which, administrators often struggle to figure out the norms of performance of a measure. To set an Automatic Minimum Threshold for the Free memory measure, instead of the Static Minimum Threshold, first select the None check box against Static to disable Static thresholding, and then deselect the None check box against Automatic to enable Automatic thresholding (see Figure 10).
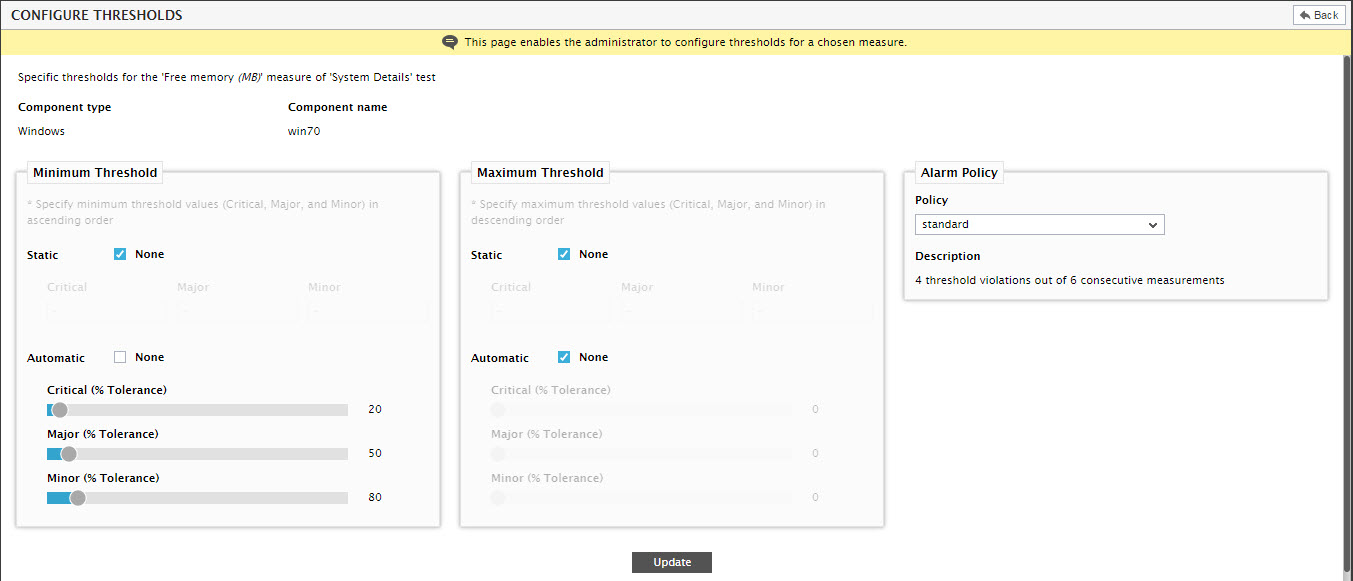
Figure 10 : Configuring Automatic Minimum Thresholds for the Free memory measure
- Using the ‘slider controls’ provided by the configure thresholds page, you can even weave a leniency factor into your auto-computed performance limits. For instance, you may want the eG Enterprise system to ignore a condition where the Free memory is 20% of its auto-computed threshold. However, you would want the monitoring system to alert you if the Free memory value is lower than 20% of the auto-computed baseline. In this case, you can use the slider controls to factor in the ‘tolerance level’ of 20% into the auto-computed baselines. Like the Static Thresholds, multiple levels of Automatic Thresholds can also be set. For the Free memory measure in our example, let us make sure that a Critical alert is generated if Free memory is less than 20% of the auto-computed thresholds, a Major alert is generated if the amount of Free memory is lower than 50% of the auto-computed baseline, and a Minor alert is generated if the actual Free memory value is less than 80% of the auto-computed limit. For this purpose, first click on the knob on the slider control below Critical and drag the knob until the reading touches 20. Similarly, toggle the slider controls under Major and Minor in Figure 9.14 and make sure that the tolerance level is set to 50 and 80 respectively. Note that your tolerance levels should also be in the ascending order. Here again, you can skip one/two tolerance levels, if you do not want to provide any specification for them.
- With that, we have learned how to configure Automatic Minimum Thresholds for a measure.
-
Alternatively, you can even configure your Minimum Thresholds to include a combination of Static values and Automatic baselines (see Figure 11). To achieve this, first deselect the None checkbox against Static to enable static thresholding. Then, manually specify absolute values in the Critical, Major, and Minor text boxes. Next, enable Automatic thresholding by deselecting the None check box against Automatic, and then use the slider controls to provide Critical, Major, and Minor tolerance levels.
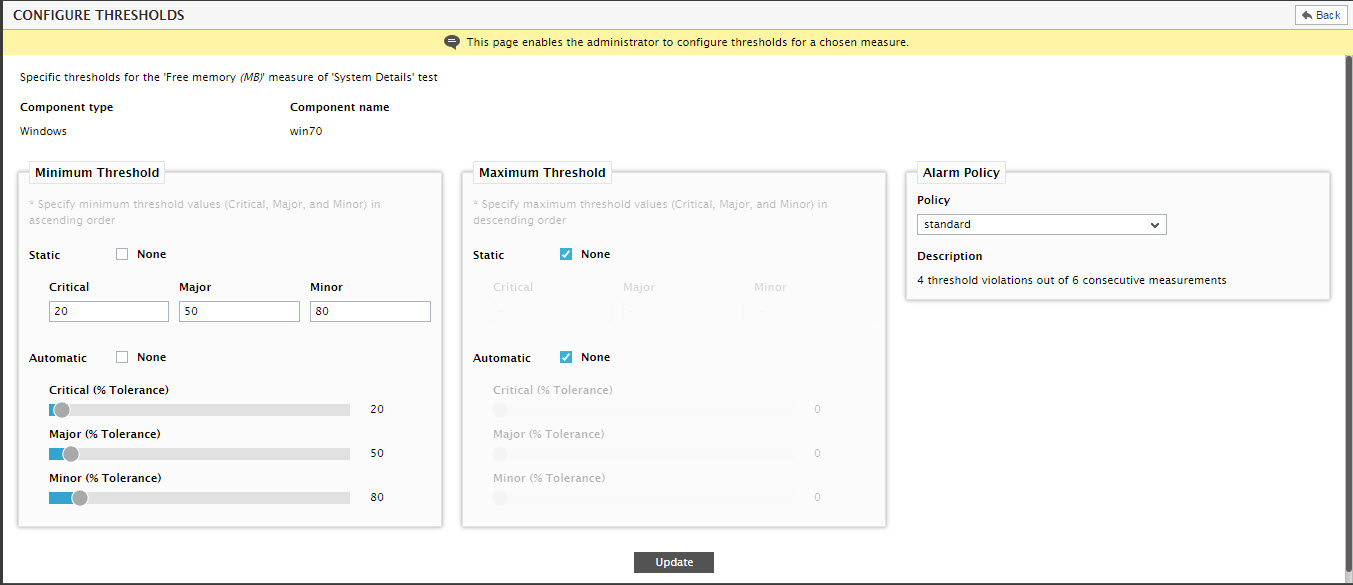
Figure 11 : Configuring Auto-static Minimum Thresholds for the Free memory measure
- When Auto-static Minimum Thresholds are configured, then, at any given point in time, eG Enterprise compares the actual performance results with the lower of the two threshold specifications, and thus isolates violations.
-
Once you have configured thresholds for a measure, assign an Alarm Policy to that measure by picking a Policy from the Alarm Policy section of Figure 11. Alarm policies indicate when alarms are to be generated for a measure. To know more about Alarm Policies, refer to Alarm Policies.
Note:
-
As can be inferred from Figure 11, the thresholds set for every measure is accompanied by an Alarm Policy specification. This specification indicates when alarms should be generated by the eG manager. The priority that will be assigned to such an alarm depends upon the threshold configuration and its corresponding alarm policy specification. By default, the following rules are applied when determining the alarm priority, if the number of violations in a time window matches the alarm policy specification (e.g., 4 out of 6):
- If all violations are critical, then alarm priority would be critical
- If all violations are major, then the alarm priority would be major
- If all the violations are minor, then the alarm priority is minor
- If the number of critical violations is greater than the number of major, and the number of critical violations is greater than the number of minor violations, then the alarm priority is critical
- If the number of major violations is greater than or equal to the number of critical violations, and the number of major violations is greater than the number of minor violations, then the alarm priority is major
- In all other cases, the alarm priority is minor
- To change the abnormal state of a measure back to Good, eG first checks if the number of good states in the window is greater than or equal to min (½ the Window size, total violations configured). For instance, in the alarm policy assigned to an abnormal measure, if the Window size is set to 4, and Number of crossings is 3, then the min(2,3)=2. In this case therefore, eG first checks if the measure registers a Good state for at least 2 consecutive test periods. If so, then eG changes the state of the measure back to Good.
-
- In the same way, if required, you can also set a Maximum Threshold for the Free memory measure. However, it is pointless to set an upper bound for the Free memory measure, because the higher the Free memory, the better the performance of the host. If you want to save the threshold settings for the Free memory measure, click the Update button in Figure 9.15.
- Now, let us take a different example to understand how a Maximum Threshold is to be set. Let us take the case of the Disk I/O time measure reported by the Disk Activity test. The Disk I/O time measure reports the average time taken by a disk to perform read/write operations. A sudden spike/steady increase in the value of this measure therefore is a sign of a problem condition. To ensure that administrators are alerted to surges in the value of this measure, you need to configure a Maximum Threshold for this measure. A Maximum Threshold is violated if the actual value of a measure exceeds/grows beyond the maximum threshold level.
-
Like in the case of Minimum Thresholds, you can configure Static Maximum Thresholds, Automatic Maximum Thresholds, or Auto-static Maximum Thresholds for a measure. Figure 12 depicts how Static Maximum Thresholds can be configured for the Disk I/O time measure.
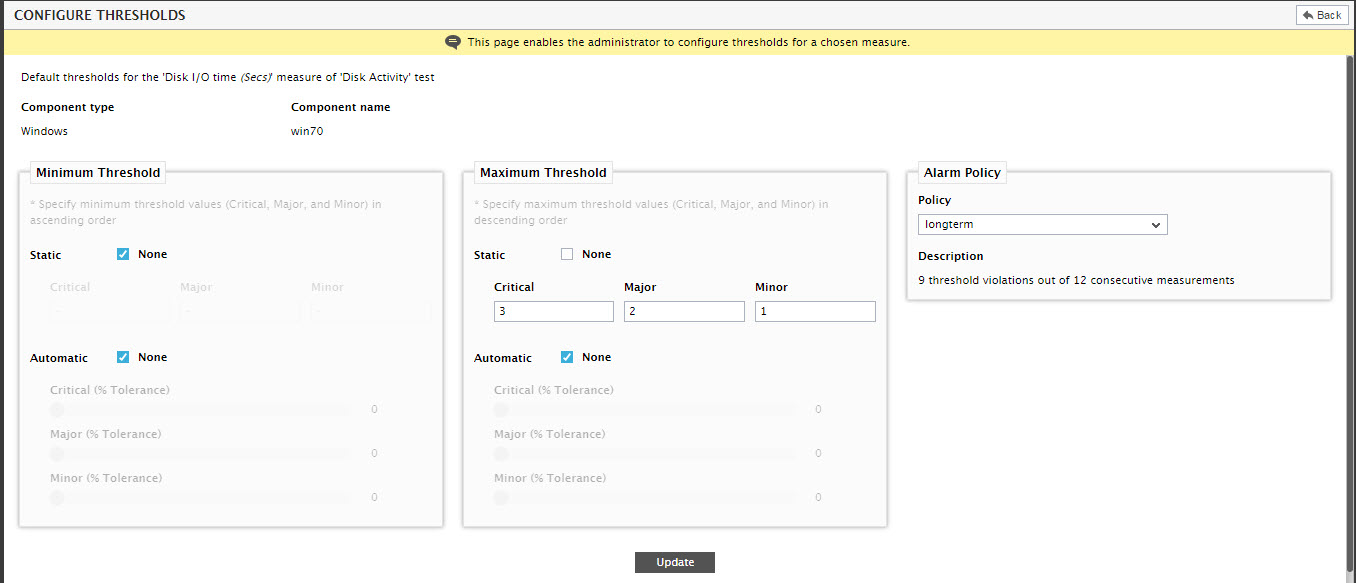
Figure 12 : Configuring Static Maximum Thresholds for the Disk I/O time measure
-
The steps to be followed for configuring Static Maximum Thresholds for the Disk I/O time measure are as follows:
- First, deselect the None check box against Static in the Maximum Threshold section, as depicted by Figure 12. This will enable Static thresholding.
- Then, proceed to specify Critical, Major, and Minor threshold values in the respective text boxes. For the Disk I/O time measure, these threshold values should be in seconds. When specifying the Maximum Threshold, note that the Critical, Major, and Minor threshold values should be provided in the descending order – i.e., the Critical threshold should be configured with the highest value and the Minor threshold should be configured with the lowest value. In the case of our example, let us configure the eG Enterprise system to change the state of the Disk I/O time measure to Critical, if the value of this measure exceeds 3 seconds, change the measure state to Major, if the value of this measure exceeds 2 seconds, and change the measure state to Minor, if disk read/write operations take over 1 second to complete. Accordingly, set Critical to 3, Major to 2, and Minor to 1, as shown by Figure 12.
- If you so desire, you can skip one/two threshold levels. For example, you can configure Critical Static and Major Static thresholds, and omit the Minor Static.
-
If disk activity is very dynamic in your environment, then it may not be advisable to go with static thresholds, which do not change with time. In such cases, it is best practice to disable static thresholding and enable Automatic thresholding instead. To auto-compute the baselines for the Disk I/O time measure, first select the None check box against Static in the Maximum Threshold section, to disable static thresholding. Then, deselect the None check box against Automatic to enable auto-thresholding (see Figure 13).
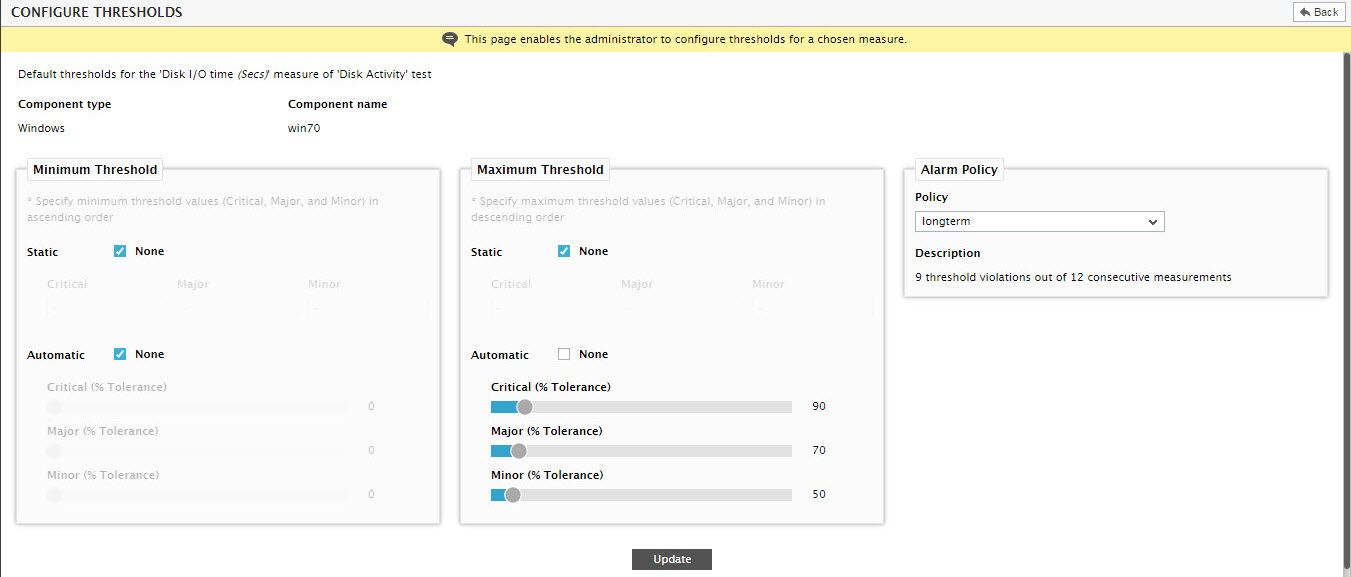
Figure 13 : Configuring Automatic Maximum Thresholds for the Disk I/O time measure
-
Then, follow the steps below:
- Use the slider controls that correspond to Critical, Major, and Minor to set tolerance levels for your auto-computed thresholds (see Figure 13). This is necessary if you want to induce the eG Enterprise system with some degree of tolerance towards problem conditions. For instance, you may want the eG Enterprise system to tolerate deviations from the auto-computed norms until the Disk I/O time measure reports a value that is over 50% of the auto-computed norm. If the ’50 %’ limit is crossed, then, you may want the system to generate a Minor alert for the Disk I/O time measure. This ensures that the eG Enterprise system disregards – i.e., tolerates - all violations in the range of 1% - 50%. Similarly, you may want eG to generate a Major alert if the Disk I/O time exceeds 70% of its auto-computed threshold, and a Critical alert if the same measure exceeds 90% of its auto-computed baseline. To configure these tolerance levels, use the Critical, Major, and Minor slider controls in Figure 13. Click on the knob in the slider control and keep dragging it to the right or left until the value you desire is displayed alongside. Dragging the knob to the right will increase the tolerance level and dragging it to the left will reduce it. Like the Static Thresholds, the Automatic Thresholds should also be in the descending order.
- If you so desire, you can skip one/two tolerance levels. For example, you can set a tolerance level for Critical and none for Major and Minor.
-
If your environment is characterized by long spells of disk inactivity followed by a sudden increase in disk activity, then a combination of Static and Automatic thresholding – i.e., Auto-static Thresholding – is most suitable for the Disk I/O time measure. To configure auto-static maximum thresholds for the Disk I/O time measure, first, deselect the None check box against Static and Automatic, as depicted by Figure 14. This will enable both capabilities.
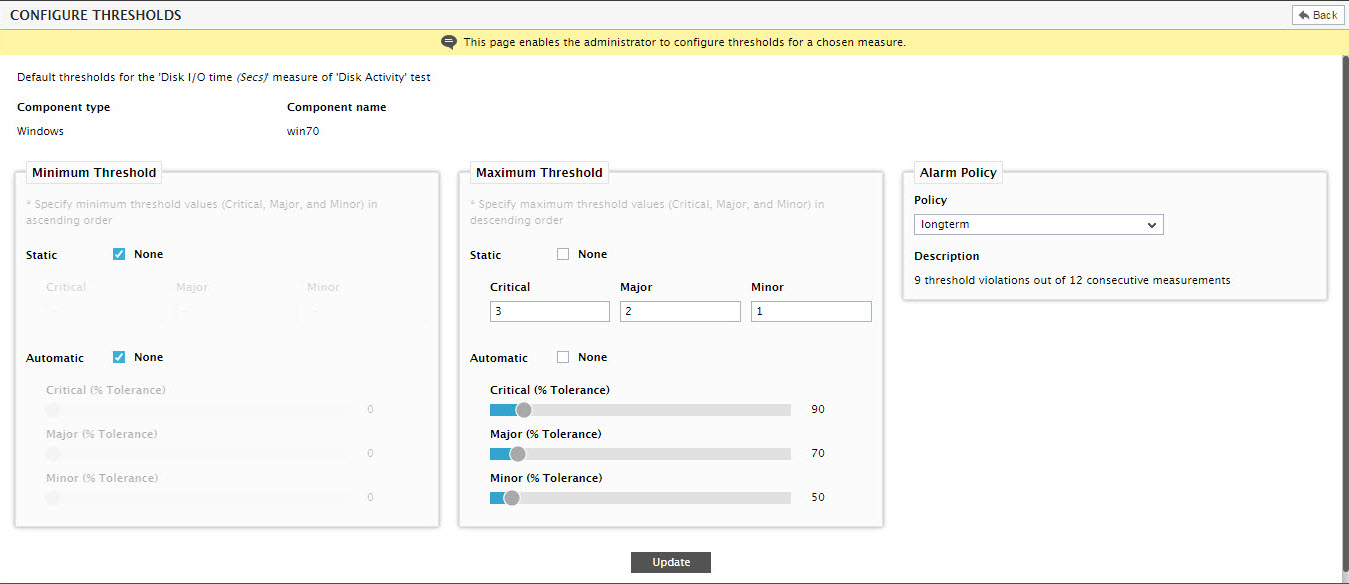
Figure 14 : Configuring Auto-static Maximum Thresholds for the Disk I/O time measure
- Then, provide absolute values, in descending order, against the Critical, Major, and Minor text boxes. Likewise, provide a tolerance %, in descending order, using the Critical, Major, and Minor slider controls.
- When, both automatic and static maximum thresholds are available for a measure, then, at any given point in time, eG will compare the actual value of the measure with the higher of the two (static and automatic) threshold values, and thus detect deviations.
-
Once you are done with configuring thresholds for a measure, assign an Alarm Policy to the measure by selecting a Policy from the Alarm Policy section of Figure 14. To know more about alarm policies, refer to Alarm Policies.
Note:
-
As can be inferred from Figure 14, the thresholds set for every measure is accompanied by an Alarm Policy specification. This specification indicates when alarms should be generated by the eG manager. The priority that will be assigned to such an alarm depends upon the threshold configuration and its corresponding alarm policy specification. By default, the following rules are applied when determining the alarm priority, if the number of violations in a time window matches the alarm policy specification (e.g., 4 out of 6):
- If all violations are critical, then alarm priority would be critical
- If all violations are major, then the alarm priority would be major
- If all the violations are minor, then the alarm priority is minor
- If the number of critical violations is greater than the number of major, and the number of critical violations is greater than the number of minor violations, then the alarm priority is critical
- If the number of major violations is greater than or equal to the number of critical violations, and the number of major violations is greater than the number of minor violations, then the alarm priority is major
- In all other cases, the alarm priority is minor
- To change the abnormal state of a measure back to Good, eG first checks if the number of good states in the window is greater than or equal to min (½ the Window size, total violations configured). For instance, in the alarm policy assigned to an abnormal measure, if the Window size is set to 4, and Number of crossings is 3, then the min(2,3)=2. In this case therefore, eG first checks if the measure registers a Good state for at least 2 consecutive test periods. If so, then eG changes the state of the measure back to Good.
-
- Finally, click the Update button to register the changes.
-
Once threshold specifications are updated, Figure 15 will appear allowing you to review your changes.
- You can proceed to configure thresholds for more measures listed in Figure 15 using the same procedure described above. Alternatively, you can also remove all the threshold configurations you see in Figure 15 by simply clicking the Delete button therein.
-
When configuring component-specific thresholds, Figure 15 will additionally allow you to apply the threshold specifications of one component to one/more other components of the same type. To do so, click the Apply to other components button in Figure 15.
Note:
The Apply to other components button will be enabled only if more than one component of a type has been managed in the eG Enterprise system.
-
This will invoke Figure 16. To quickly get to the components to which the threshold configuration needs to be replicated, use the View By drop-down in Figure 16. By default, the Component option will be chosen from the View By list. Accordingly, all other managed components that are of the same type as that component whose threshold configuration is to be copied, will be displayed in the Existing components list box in Figure 16. Where too many managed components of the same type exist, you can further narrow your search, by selecting one of the following options from the View By list:
- Zone: Select this option from the View By list and then select the specific Zone to which the components of interest to you belong. This will populate the Existing components list box with those zone components that are of the same type as the component whose threshold settings are to be copied.
- Segment: Select this option from the View By list and then select the specific Segment to which the components of interest to you belong. This will populate the Existing components list box with those segment components that are of the same type as the component whose threshold settings are to be copied.
-
Service: Select this option from the View By list and then select the specific Service to which the components of interest to you belong. This will populate the Existing components list box with those service components that are of the same type as the component whose threshold settings are to be copied.
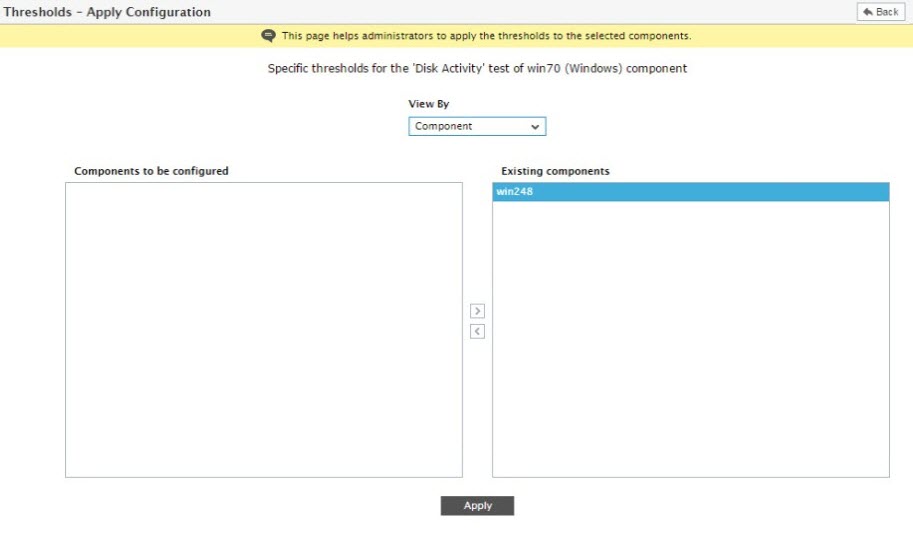
Figure 16 : Selecting the components to which the threshold configuration is to be replicated
- Next, from the Existing components list, select the components to which the threshold configuration is to be copied. Then, click the < button in Figure 16.
-
This will transfer the selection to the Components to be configured list (see Figure 17).
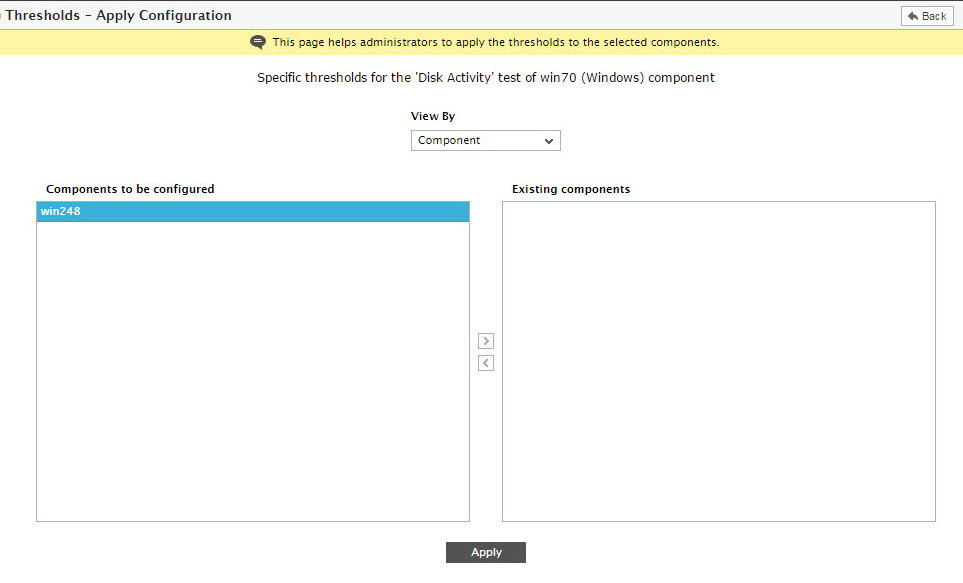
Figure 17 : Applying the threshold configuration of one component to other components of the same type
-
Finally, click the Apply button in Figure 17.
Note:
By default, the eG agent initiates the process of test execution and threshold downloads, simultaneously. Though these key processes begin together for a test, at least a minimal difference in their completion times is inevitable. In some cases, this discrepancy could cause real-time deviations to go undetected. Take the case of the UptimeTest for instance. Typically, this test is used to monitor the up time of critical Windows/Unix servers in a target environment, and to alert administrators when a reboot occurs. Now, assume that the Rebooted measure of this test has a maximum threshold of 0; the value 0 for this measure indicates that the server has not been rebooted during the last measurement period. If the server were to reboot during a measurement period, then this value would become 1, compelling the eG agent to generate an alert. Say, when the UptimeTest ran for the first time, the test completed execution and reported measures before the thresholds were downloaded. The agent therefore, was unable to detect any abnormalities and hence generated no alerts. To ensure that critical state-changes are not missed, administrators can configure the eG Enterprise system in such a way that tests reporting ultra-critical measures are started after the corresponding thresholds are downloaded. The eg_tests.ini file (in the <EG_INSTALL_DIR>\manager\config directory) consists of an [immediate_thresholds] section, which facilitates this configuration. Here, by default, the UptimeTest is set to yes. This indicates that the UptimeTest executes only after the related thresholds are downloaded by the eG agent. You can append more tests to this list (as indicated below), so that such tests are executed after the eG agent downloads their threshold values.
[IMMEDIATE_THRESHOLDS]
UptimeTest=yes
ProcessTest=yesAlternatively, you can configure the thresholds of all tests to be downloaded prior to test execution, by setting the AllImmediateThresholds flag in the [agent_settings] section of the eg_tests.ini file to yes. By default, this flag is set to no.