Maintenance Analysis
Maintenance is a mandatory task in many large IT infrastructures. Maintenance procedures would be regularly performed on the components in such infrastructures to ensure peak performance. Also, to minimize false alarms that might be raised during maintenance, maintenance policies might have been configured for a wide majority of these components using the eG administrative interface. The key need of the administrators of such large environments therefore is the knowledge of which components are under maintenance, at what level (i.e., host/component/test-level), and when the next maintenance cycle is scheduled for these components, so that they can promptly alert service managers and domain experts about the non-availability of their critical applications/devices during the maintenance periods. Moreover, since new components will continue to be added to such infrastructures, it is also the responsibility of the administrator to analyze and identify those components which need to brought under the purview of maintenance.
To provide administrators with quick and easy access to maintenance-related information and to enable them to efficiently review and analyze maintenance schedules, eG Enterprise provides a Maintenance policy analysis page which appears upon clicking the ![]() icon in the MAINTENANCE POLICIES page. This page serves as a single, central interface using which administrators can view and analyze the maintenance policies configured and applied across the environment.
icon in the MAINTENANCE POLICIES page. This page serves as a single, central interface using which administrators can view and analyze the maintenance policies configured and applied across the environment.
To analyze maintenance details using this page, do the following.
- First, pick a criterion for analysis from the Analysis By list. The options are: All, Host, Component, Test, Test for Host, Test for Component, Descriptor, Descriptor for Component, Policy, Time Constraints and Wild Card.
-
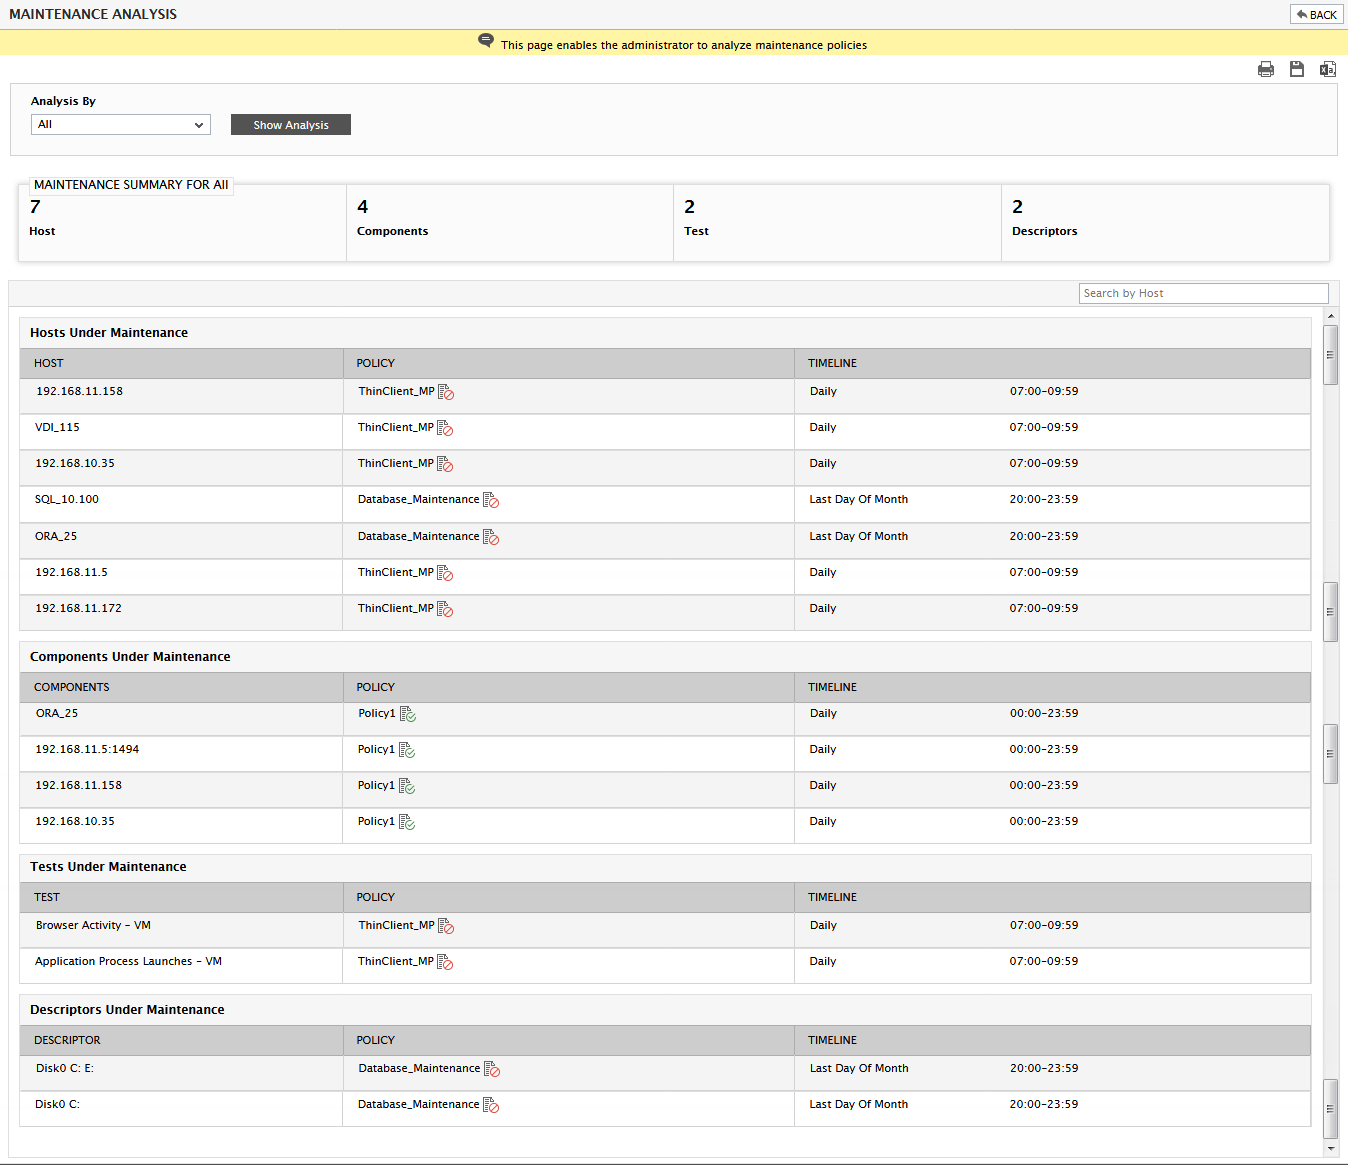
For instance, if the All option is chosen, then the complete details of all policies configured – i.e., the policy names, the policy specification, and the elements they are applied to - will be displayed (see Figure 1).
-
Likewise, if the Hosts option is chosen from the Analysis By list, then you can either pick the Host for which you want to perform maintenance analysis or perform the analysis across All hosts. To pick a particular host, you can use the Search text box. Here, you can specify the whole/part of the host name to search for and click the ‘magnifying glass’ icon to search for hosts that match the specified search string. If such hosts are found, they will be displayed in the Host list, from which you can quickly select the host of interest to you. If you then click the Show Analysis button, the complete details of all policies that apply to the chosen host will appear (see Figure 2).
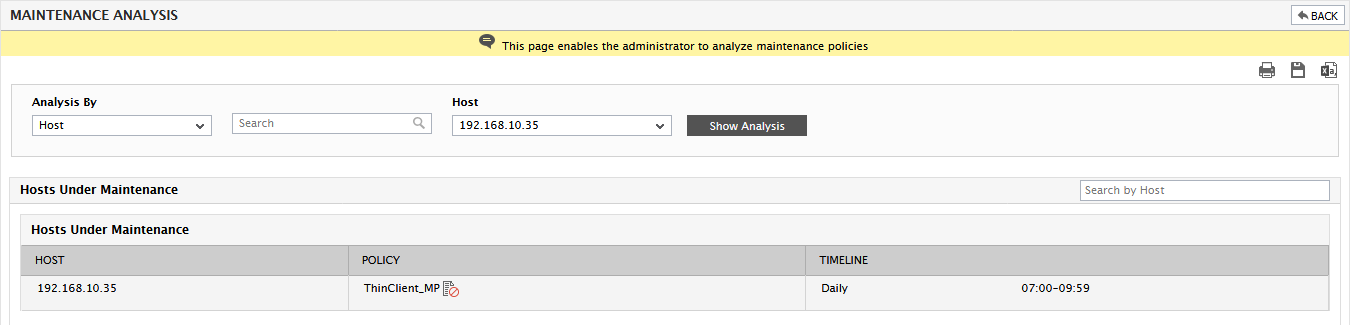
Figure 2 : Maintenance analysis of a chosen Host
Note:
By default, the Host option is not available for a user possessing the MonitorWithLimitedAdmin privilege. If such a user wants to analyze the maintenance policies based on the hosts, then he/she should do the following:
- Open the eg_maintenance.ini file available in the <eG_INSTALL_DIR>\manager\config folder.
- Set the showHostForLimitedAdmin to yes. By default, this flag is set to No.
- Finally, save the file.
This will ensure that the Host option is listed in the Analysis by list.
-
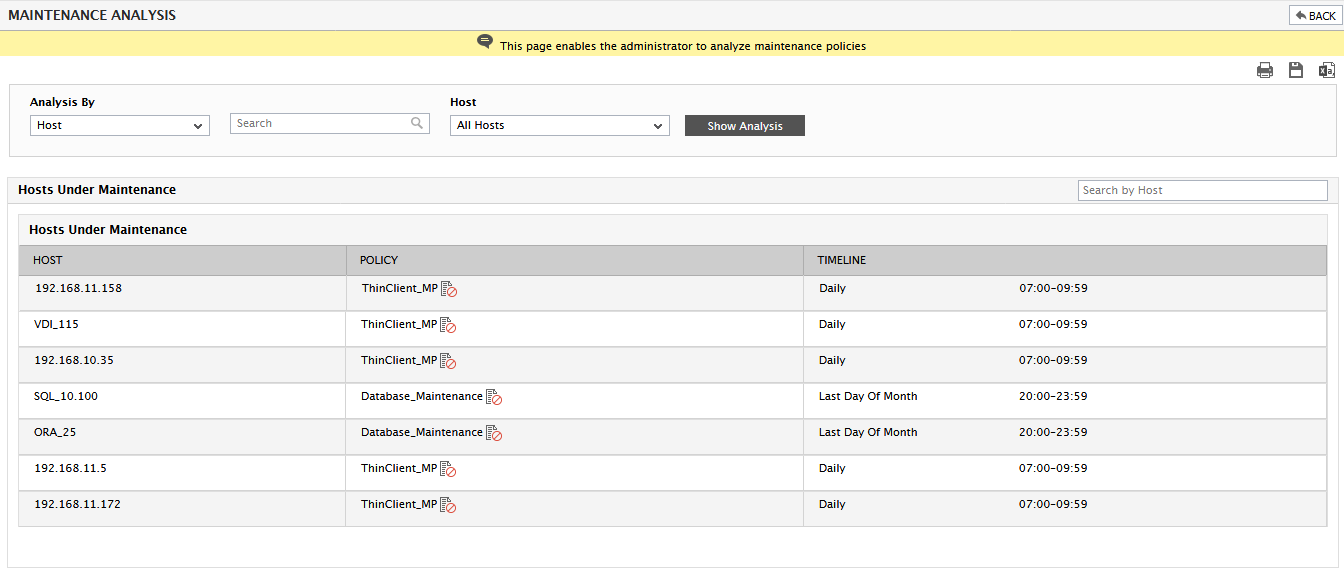
To analyze across hosts, pick the All option from the Host list. In this case, all hosts under maintenance will be displayed and the policies that are associated with each host will be revealed (see Figure 3).
- This way, you can view the policy details for one/all Components, Test, Tests for Host, Tests for Component, Descriptors, Descriptors for Component.
-
In addition, you can also view the details of a particular policy. For this, first pick Policy from the Analysis By list. Then, select a particular policy from the Policy list. Optionally, you can also use the Search text box to quickly locate the policy of interest to you. In this case, specify the whole/part of the policy name to search for and click the ‘magnifying glass’ icon to search for policies that match the specified search string. If such policies are found, they will be displayed in the Policy list, from which you can quickly select a policy. Then, click the Show Analysis button. Figure will then appear reviewing the number and names of elements to which the policy applies (see Figure 4).
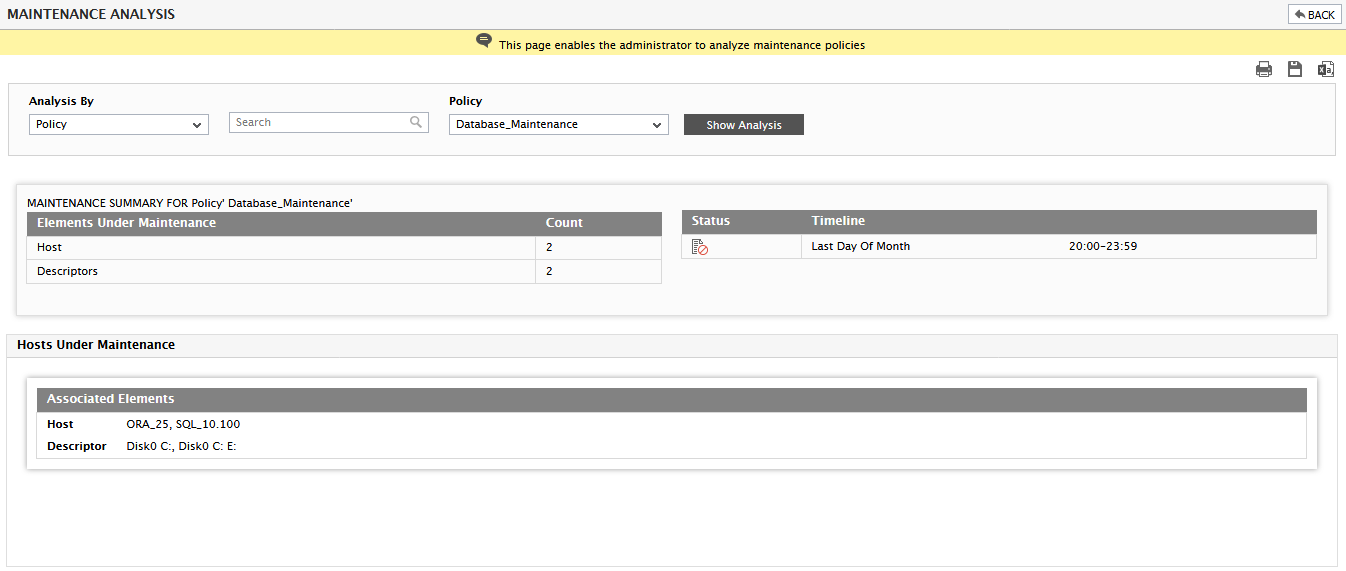
Figure 4 : Performing maintenance analysis of a particular policy
-
You can also select the Time Constraints option from the Analysis By list to view the details of those policies that are applicable during a timeline selected from the Time Constraints list (see Figure 5).
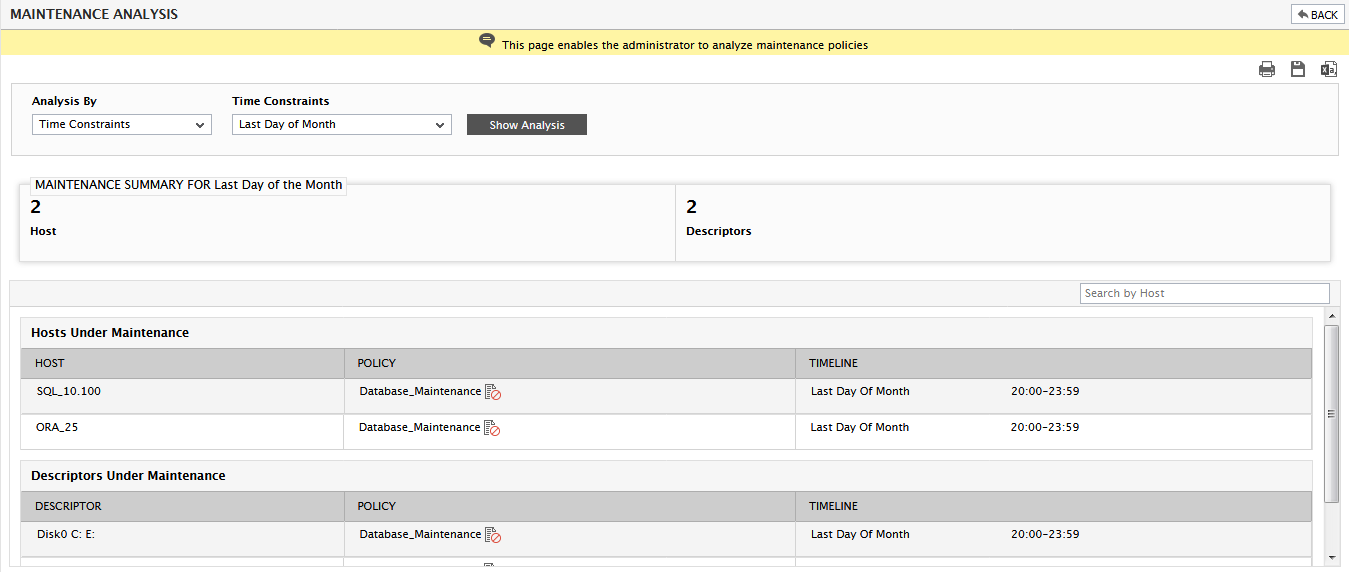
Figure 5 : Maintenance analysis of policies to which a chosen Time Constraint applies
-
You can also choose the Wild Card option from the Analysis By list to view the details of those policies that are applied on the Server/VM/Desktops using Wild Card patterns. Choosing this option will list all the Wild card patterns created in your target enironment in the Pattern list box. you can also use the Search text box to quickly locate the policy of interest to you. In this case, specify the whole/part of the policy name to search for and click the ‘magnifying glass’ icon to search for policies that match the specified search string. Clicking the Show Analysis button will list all the Server/VM/Desktops on which the maintenance policy with the chosen wild card pattern is applied.
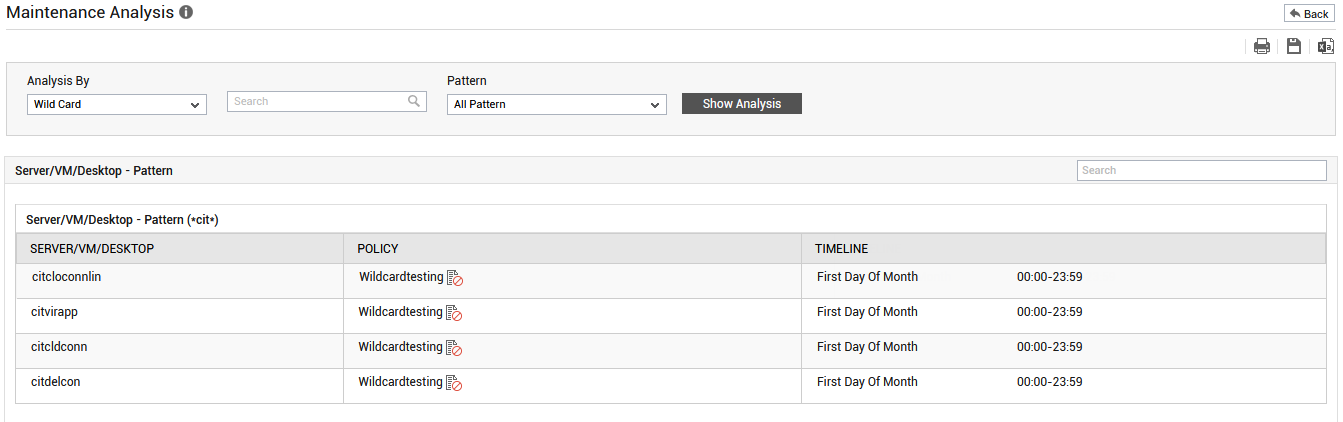
Figure 6 : Maintenance Analysis of policies applied to Server/VM/Desktops using wild card patterns
- At any given point in time, you can Save the results of the analysis as a PDF file or a CSV file or print the same using the corresponding icons at the right, top corner of the maintenance analysis page.