Metric Aggregation
eG Enterprise typically monitors every component of a type, separately. However, sometimes, business owners may require aggregate metrics about their infrastructure. For instance, Citrix administrators might want to know the total number of users who are currently logged into all the Citrix servers in a farm, so that sudden spikes in the load on the farm (as a whole) can be accurately detected. Similarly, Windows administrators might want to figure out the average CPU usage across all the Windows servers in an environment, so that they can better plan the capacity of their Windows load-balancing clusters.
To provide such a consolidated view, eG Enterprise embeds a license-controlled Metric Aggregation capability. This feature, when enabled, allows administrators to group one or more components of a particular type and monitor the group as a single logical component, broadly termed as an aggregate component.
Figure 1 depicts how metrics aggregation works.
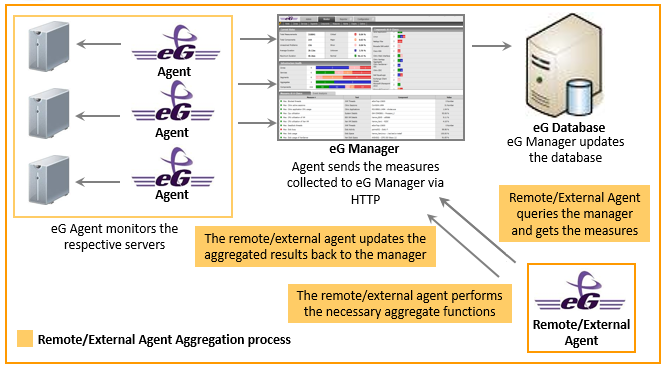
Figure 1 : How metrics aggregation works?
Typically, every eG agent that is monitoring a component grouped under an aggregate component, reports metrics collected from the corresponding component to the eG manager. The eG manager consolidates the metrics so received and stores them in the eG backend. To aggregate these metrics, eG Enterprise either requires that an external/remote agent be installed.
Note:
- The remote agent that performs metrics aggregation can be installed on any remote host in your environment.
- No special privileges need be granted to a remote agent for performing metrics aggregation.
- It is recommended that you monitor a maximum of 10 aggregate components alone using a single remote agent.
Every time an aggregate test runs, this remote/external agent queries the eG manager for the metrics collected from the member components of the managed aggregate component. On receipt of the metrics, the remote/external agent applies pre-configured aggregate functions on the metrics, and updates the eG manager with the aggregated performance results.
Separate thresholds need to be set for the aggregated metrics to track deviations in the consolidated performance. The state of the aggregate component is governed by these exclusive thresholds, and not by the state of the components within the group.
Metrics Aggregation is a license-controlled capability. If remote agents are used to perform metric aggregation, one/more premium monitor licenses would be required for implementing this capability. However, if an external agent is used to perform metric aggregation, no license is required for implementing this capability.
Using this Metric Aggregation capability, administrators can perform the following:
- Effectively assess the collective performance of a group of components of a particular type
- Easily study load and usage trends of server farms (or groups) as a whole
- Accurately detect resource inadequacies or unusual load conditions in the component group or farm
- Compare and correlate the performance of the member components with that of the aggregate component, so that the reasons for performance issues with the aggregate component can be precisely determined;
Note:
Configuration tests are not applicable for Aggregate Components.