Quickly Launching a Third Party Console from the eG Monitoring Console
In environments where multiple monitoring solutions - one each for every component silo - are deployed, you may want to seamlessly integrate the eG monitoring console with a few or all of these solutions, so as to enable effective investigation and swift identification of the source of problems with the associated components.
Using the eG administrative interface, you can now configure the URLs for launching third-party management consoles from the eG monitoring console. Each such URL is called an External Monitor. By associating these monitors with specific component silos, you can enable users to the eG monitoring console to quickly drill down to third-party consoles whenever the associated components experience performance issues, use the expertise of the third-party tools to analyze these issues, and thus accurately diagnose their root-cause.
To configure external monitors, do the following:
- Select the External Monitors option from the Miscellaneous tile.
-
If no monitors pre-exist, the message depicted by Figure 1 will appear.
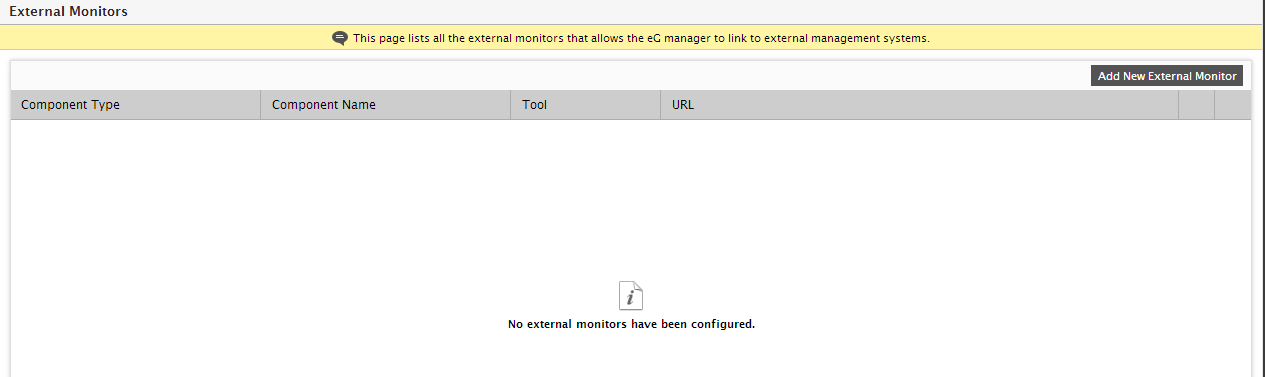
- To add a new monitor, click on the Add New External Monitor button in Figure 1.
-
Figure 2 will then appear, using which you can configure the new external monitor.
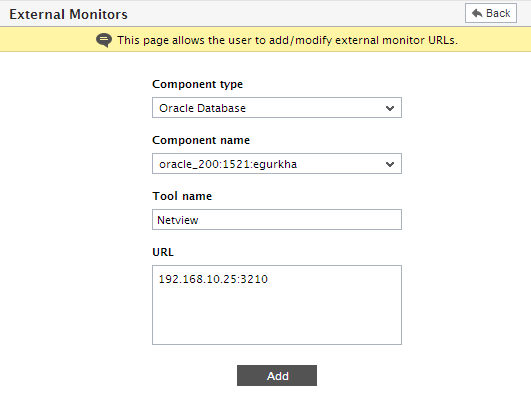
- Select the Component type for which the external monitor is to be configured.
- The Component Name list will then be populated with all components of the chosen type. Pick the component with which the new monitor is to be associated.
- Specify the name of the third-party monitoring tool that is being integrated with the eG Enterprise in the Tool name text box.
- Specify the URL of the web page that should appear when users attempt to launch the third-party monitoring console from the eG monitoring console.
- Finally, click the Add button.
- The External Monitor so added will then be visible in the layer model page (of the eG monitoring console) of the corresponding component. The Tests panel of the layer model page of that component will display a link (bearing the configured third-party tool name), which when clicked will instantly launch the monitoring console of the corresponding tool.