Self-Monitoring and Recovery
To ensure enterprise-class monitoring, the eG manager includes the capability to monitor its various components and to recover from failure of these components. When the eG manager is started, a separate eG recovery process is started. On Unix environments, this process is called eGmon. On Windows environments, this process executes as a service named eGmon.
This process periodically attempts to connect to the eG manager, access the various components of the manager, including the eG database. If it detects any problems during such access, the recovery process attempts to perform further diagnosis. The specific actions performed by the recovery process are as follows:
- If the eG manager is not accessible, the recovery process attempts to restart the eG manager. If it fails to restart the eG manager thrice in succession, the recovery process generates an alert message to the eG administrator (using the MAIL SENDER ID specified in the Mail Configuration settings of the administration interface).
- If the eG manager is accessible, the recovery process tests the connections from the eG manager to the database server that it uses. In the event it detects problems, it alerts the administrator of potential problems with the database server access. By connecting directly to the database server (i.e., without using any other eG manager components), the recovery process further determines whether the database access problem is being caused either because of a database failure or because the eG manager's pool of database connections is not sufficient to handle the current load on the manager.
When the eG manager is stopped manually, the eG recovery process is also shutdown.
To further improve its resilience to failures, eG Enterprise is architected in such a way that when an eG agent is not able to report measurements to the manager, it stores a local copy of the measurement results. When its connection to the manager is re-established at a later time, the agent uploads the saved measurement results to the manager, thereby ensuring that measurement results are not lost even if the manager/agent connection fails temporarily.
Note:
Handling of Old Data from the eG Agents:
Typically, if the network link between an eG agent and the manager goes down, the agent stores the metrics it collects locally and later once the link comes back up, the agent uploads the metrics to the eG management console. This design ensures that loss of monitoring data during network outages is minimized. A configuration setting on the eG manager governs how the eG manager handles old data being sent by an agent to it. This setting is the OldDataIgnorePeriod entry in the eg_db.ini configuration file in the <EG_INSTALL_DIR>\manager\config directory of the eG manager. If this entry is unavailable or if its value is -1, the eG manager chooses to process the old data being sent by the agent as if the data has been generated in real-time. Thus, all measurement results from the agent are analyzed and alerts generated by the eG manager if any abnormality is detected.
Some administrators may prefer not to have the eG manager process old data. For instance, suppose the network link has been down for 3 hours, and during this period, a process went down for a while and came back up. The eG agent's measurements would indicate the change in state of the process, and if the eG manager processes the old data, it would first generate an alert indicating that the process went down, followed by an almost immediate event indicating that the process has restarted. Administrators who do not wish to receive alerts for older data from the agents can define the period of time beyond which the eG manager determines that data being received from the agents is old data. For example, if the OldDataIgnorePeriod is set to 10, the eG manager will consider all data that has a timestamp earlier than 10 mins prior to its current time as old data, and state computations and alarm correlation are not performed using such data.
The eG agents too include self-monitoring capabilities. When the eG agent is started, a separate recovery process is also started. On Unix environments, this process is driven by a script eGAgentmon. On Windows environments, this script executes as a service named eGAgentmon.
Every 5 minutes, this script spawns a process named java EgCheckAgent, which checks if the agent is alive or not. If the agent is found to have stopped abnormally, then java EgCheckAgent process restarts the agent. The recovery process records all of the recovery actions it attempts and records the outcome (i.e., whether success or failure) of these actions in the agent log file, which is located in the <EG_HOME_DIR>/agent/logs/error_log). EG_HOME_DIR refers to the installation directory of the eG manager and agents (eg. /opt/egurkha on Unix, C:\Program Files\eGurkha on Windows).
However, note that if the eG agent is stopped manually, the agent recovery process is also shutdown.
So far we have highlighted the key components of eG Enterprise. The four stages in deploying eG Enterprise in the target environment are :
-
Installation of the eG manager and the agents. This stage mainly involves deployment of the software on the appropriate components, creating user accounts, and setting up the directory structures.
-
Configuration of the eG manager and the agents. In this stage, the environment is set up for the proper operation of eG Enterprise and the manager and agent processes are started.
Note:
Please refer to “The eG Installation Guide” for a detailed description on the above two stages.
- Administration of the eG Enterprise system. At this stage, the user interacts with the eG manager through the eG user interface to determine where agents must be deployed, what tests these agents must run, how often the tests should run, etc.
- Monitoring using the eG Enterprise system. At this stage, using the user interface, users can monitor various aspects of their IT infrastructure.
Figure 1 depicts the various stages involved in deploying eG Enterprise in a target environment.
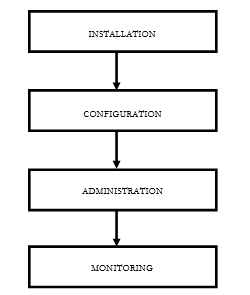
Figure 1 : Stages involved in deploying eG Enterprise
For details of the first two steps, please refer to the Detailed Installation Guide. The rest of this manual focuses on the third and fourth steps.