Types of Thresholds
eG Enterprise supports the following thresholding capabilities:
- Static
- Automatic
- Auto-static
- None
Static Thresholds
For many metrics, thresholds can be set statically. For instance, based on the service level expectations and agreements, IT managers can set thresholds for metrics such as network availability, CPU usage, and latency. Application availability and response time can also be handled in the same manner. For example, availability should be 100% whenever the metric is measured. If not, a violation should be detected. Likewise, a network latency of several seconds is usually an indicator of a problem, no matter what time of day the measurement is made at.
To enable administrators to set static baselines for time-invariant measures such as the ones discussed above, the eG Enterprise system includes the static thresholding capability.
To illustrate how static thresholding works, consider the example of the disk activity of a host. The Disk busy measure should never exceed a prescribed limit. Therefore, absolute threshold limits have to be explicitly defined for the Disk busy measure in the Absolute Maximum and Absolute Minimum columns of Figure 1. The graph in Figure 1 depicts the absolute threshold values of the Disk Busy measure and its actuals.
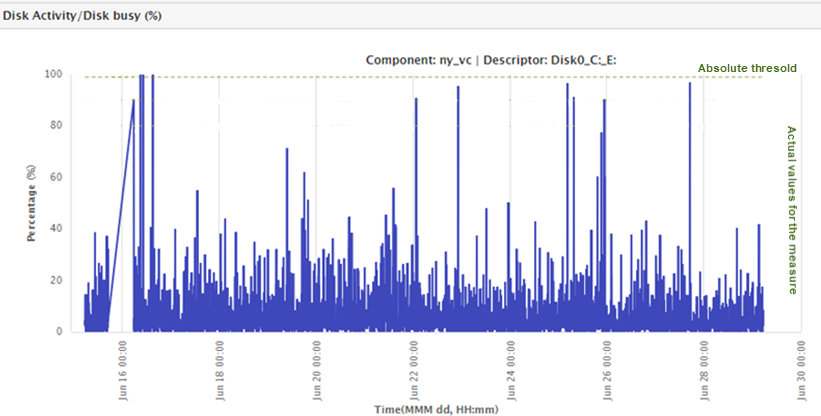
Figure 1 : Measure graph of the Disk busy measure indicating the set absolute thresholds and the actual values
Often, there is a need to set different threshold levels to map to different levels of severity of problems. The eG Enterprise system offers three levels of thresholds that correspond to the three alarm priorities - Critical, Major, and Minor. The user has to specify three maximum and/or three minimum threshold values in the format: Critical/Major/Minor. While the maximum thresholds are to be provided in the descending order, minimum thresholds have to be specified in the ascending order. For example, take the case of the Percent usage measure of Figure 1. This measure reports the percentage of time that the disk has been busy processing the requests. The user can set a single Maximum threshold of say, 98, and expect to be alerted when the disk load crosses 98%. Alternatively, the user can also set multiple maximum thresholds, thereby instructing the eG Enterprise system to send different types of alerts at various levels of disk usage - in other words, the user can instruct the eG Enterprise system to trigger a Minor alert if the disk load crosses 80%, a Major alert if the disk load crosses 90%, and a Critical alert if it falls beyond 100%.
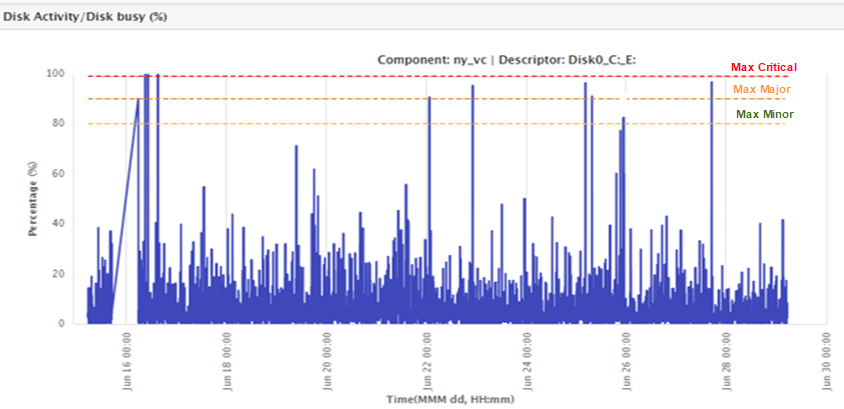
Figure 2 : Multiple thresholds set for the 'Disk Busy' measure
Multiple levels of threshold settings allow proactive alarms to be generated when a metric is slightly out of conformance, and a severe alarm to be generated when the problem worsens. This provides ample opportunity to the user to identify and attack a problem early in its life cycle.
In the case of the Percent usage measure in our example, the Maximum thresholds can be defined as "100/90/80". Since an absolute minimum threshold is not required for the Percent usage measure, it can remain as "none".
According to this specification, if the Maximum threshold of 100 is violated, then a Critical priority alarm will be generated. This is indicative of a critical issue with the host. Similarly, if the value of this measure crosses the Maximum threshold of 90, then a Major priority alarm will be generated. This is indicative of the existence of a major issue with the host. Likewise, a value beyond the Maximum threshold of 80 will result in a Minor priority alarm.
Note:
If the threshold for a measure is set to -/-/-, then, it implies that such a threshold need not be computed for that measure. For instance, if you set the Static Maximum threshold of a measure to -/-/-, it means that for that measure static maximum thresholds need not be computed. This is why, when you revisit the agent - thresholds page to simply view or modify the threshold specifications of the same measure, you will find that the Static Maximum threshold specification displays noneinstead.
Thresholds can also be set based on industry standard best practices. For example, a rule of thumb when tuning an Oracle database server is that the database dictionary cache hit ratio should be 90% or more. If the hit ratio falls below this value, it indicates a need to tune the database server. This is another example where a threshold is set statically, without considering the time of day when the measurement is being made. eG Enterprise includes pre-specified threshold values for many metrics based on industry standard best practices.
Note:
By default, if a test/descriptor is configured with static threshold and the test/descriptor violates the threshold during the first measurement period, eG Enterprise generates instant alerts and reports the same to the administrators. This alert generation process does not involve threshold computation process where thresholds are computed and stored in the eG database before alerts are raised. To this effect, the StoreAbsThresholdInDB parameter in the [MISC_ARGS] section of the eg_services.ini file available in the <EG_INSTALL_DIR>\manager\config folder is set to False. Alternately, if you wish to be alerted only after the threshold computation process for the test/descriptor is complete and the values stored in the database, set this parameter to True. This will ensure that the alerts are generated for the test/descriptor within a time period of one hour.
Automatic Thresholds
In infrastructures where a metric varies with time, a static threshold value cannot serve as a reliable basis for judging performance. For example, consider a web server hosting a web site. The number of TCP connections to the web site (i.e. the current connections measure of the TCP test in the figure below) could be rather high on a particular day and low on another. Similarly, it could be high during the working hours and low during the nights. In such situations where measurement values change with the time of the day, it is very difficult to set accurate maximum and minimum limits manually. In such cases, the threshold value for this metric also has to be time variant.
Even when a metric is not time variant, its value may change from one server to another. For example, a high-end datacenter server may be able to handle hundreds of users, whereas a low-end standard server may be able to handle only a few tens of servers. In such cases too, it is extremely laborious and time consuming to determine what the normal values are for each and every server.
To handle such situations, eG Enterprise includes an automatic thresholding capability. Using past history of the values of the metric, eG Enterprise uses tried and tested statistical quality control techniques to analyze past values of the metrics and to automatically set the upper and lower bounds for each of the metrics, using the historical data. In this approach, for example, the threshold values for a metric between 9am-10am tomorrow are based on the value of the metric for the same time period over the past days (the number of days to be looked at in the past is configurable).
Note:
You can configure how far back the manager should check for past history when computing automatic thresholds for a measurement. The default look back period is 14 days (i.e., 2 weeks). You can change this value, if required. For this, do the following:
- Select the Manager option from the Settings tile.
- From the manager settings panel to the left of the page that appears, select the Threshold Configuration option.
- Specify a Lookback period to compute automatic thresholds in the right panel, and click the Update button to register the changes.
With eG’s auto-thresholding capability, like the metric value, the threshold also is time varying. Whenever a deviation from this auto baseline (threshold) is detected, an alert is triggered. Since the baseline is set automatically, using this technique ensures that administrators are informed of problems well before they become critical enough to impact the end user experience.
Automatic thresholding is ideal for time varying metrics such as number of requests to a web server, the workload on a database server, queue lengths of requests waiting for processing, etc.
Even when thresholds are set automatically, an IT manager may want to choose a leniency factor for the thresholds. For example, an IT manager may want to allow for a 10% deviation from the norm. To accommodate such requests, eG Enterprise allows administrators to set a “sensitivity slider” for automatic thresholds. To configure the leniency factor, you need to specify the slider as a multiple of the auto-computed threshold value computed. For example, consider the case of the "Free memory" measure, which is an indicator of the amount of free memory available on a server. Assume that on one of the managed servers, the free memory is known to decrease consistently and then grow back up (e.g., the operating system frees memory periodically). In such a scenario, the free memory threshold will be violated often (since the value decreases consistently), and this will result in a number of false alerts. In such a situation, the eG administrator can set the threshold to be a multiple of the auto-computed baseline - for example, if the minimum threshold is set to 30% of auto, it implies that the administrator has introduced a 30% leniency. That is, alerts are generated only if the free memory is 30% lower than what is the normal value. This capability allows administrators to fine-tune eG's automatic thresholding capability to suit their specific requirements.
Like static thresholds, multiple automatic threshold values should only be set - one each for every alarm priority. Let us take the example of the Free memory measure. Say, that administrators wanted to be alerted to the erosion of Free memory on a target server, at various stages. While they wanted proactive minor alerts to be generated if the free memory was 30 % lower than normal, a major alert was required for a 50% reduction in free memory, and a critical alert for an alarming 70% depletion of the memory resources. To ensure this, your Minimum Automatic Threshold setting should be: 30% of auto,50% of auto, 70% of auto.
The measure graphs provided by eG Enterprise’s monitor interface can bring out the differences between static and automatic thresholding, more clearly. The graph in Figure 3 depicts the threshold limits that were automatically assigned to the Current connections measure in the example discussed above. Notice that the statistical data is very periodic and the threshold that is automatically computed by eG Enterprise follows the same pattern as the measurement values.
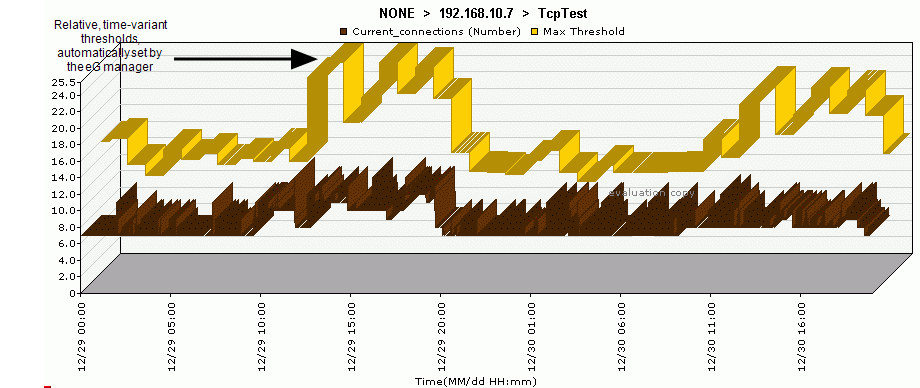
Figure 3 : Measure graph of the Current connections measure indicating the automatic thresholds and the actual values
Auto-Static Thresholds
Automatic thresholds are ideal for metrics that are time variant. Often, the same metric may vary significantly from one server to another and from time to time. Consider a staging environment with a web server. Typically, there is no load on the web server and the automatic threshold is set accordingly. When someone logs in, the threshold will be breached and an alert may be raised by the system. This is a false alert because one user logging in does not signify a situation of interest to an IT manager. This scenario shows that while automatic thresholding reduces the effort involved in configuring the monitoring tool (because IT managers do not have to configure thresholds for every metric and server), it does not eliminate false alerts.
Therefore, eG Enterprise allows IT managers to use a combination of static and automatic thresholds. A static threshold applied along with an automatic threshold provides a realistic boundary that has to be crossed before an alert is to be triggered. An IT manager can now configure an absolute maximum and an automatic maximum threshold for a metric. eG Enterprise compares the actual measurement value with the higher of the two maximum thresholds, and generates an alert only when the higher threshold is violated. In the example of the staging web server, the IT manager can set a static maximum of 100 requests in a measurement period (or a similar number representing a reasonable load). Once this is done, only if the actual load exceeds 100 requests in a measurement period, will an alert be generated, even if the auto-computed threshold is less than 100. If the auto-computed threshold is greater than 100, this value is used as the actual threshold.
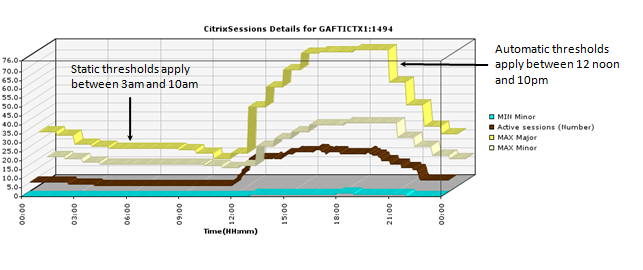
Figure 4 : An auto-static combination threshold applied to the 'Active Sessions' measure of the CitrixSessions test
As in the case with the maximum thresholds, if a static minimum and an automatic minimum threshold are specified, then eG Enterprise will generate alarms only when the current value falls below the lower of the two threshold settings.
None
If the threshold policy for a measurement is none, an eG agent will stop tracking the state of this measurement (i.e. The agent will continue to collect values for this measurement but will not generate any alarms relating to this measurement). Even in the case of static and automatic thresholding, eG Enterprise allows the minimum and maximum threshold values to be “none”.