Viewing Thresholds
At any point in time, administrators can view the configured thresholds by selecting the View option from the Thresholds menu of the Agents tile. Doing so will invoke Figure 1.
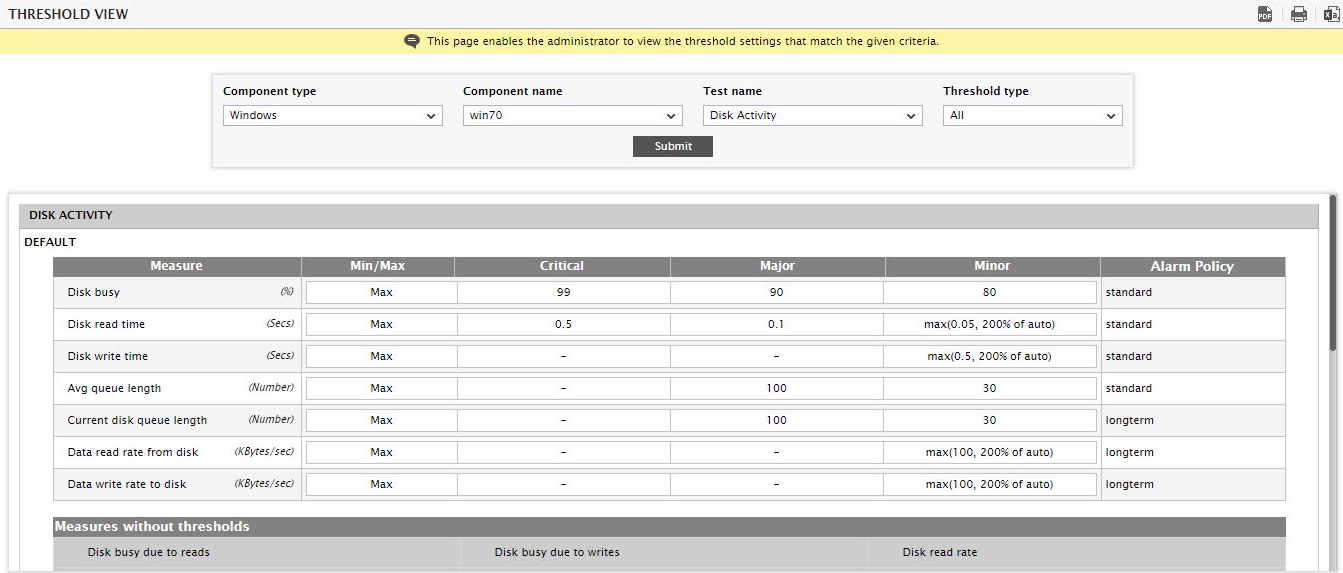
Figure 1 : Viewing configured thresholds
To review threshold settings, do the following:
- Select a Component type.
- All components of the chosen type will then populate the Component name list. Select the component for which threshold specifications are to be reviewed. To view the threshold settings for all managed components of the chosen type, select All from the Component name list.
- All the tests that run on the chosen component will then be listed in the Test name drop-down list. Pick the test for which threshold specifications are to be viewed from this list. To view the threshold settings of all tests mapped to the chosen component, select All from the Test name list.
- Then, from the Threshold type drop-down. select the type of thresholds you want to view – the options are Default, Specific, Descriptor, Group, Global, and All. To view the threshold settings of all threshold types, pick All from this list.
- Then, click the Submit button to view the threshold settings that fulfill the specified criteria.
- You can save the threshold details displayed as a PDF file, by clicking the
 icon at the right, top corner of Figure 1.
 - To print the threshold information, click the
 icon at the right, top corner of Figure 1.
 - To save the threshold details as a CSV file, click the
 icon at the right, top corner of Figure 1.