Viewing the Managed Infrastructure
While monitoring large environments using eG Enterprise, administrators may want to instantly figure out the total number of managed components in the environment across categories / component-types to assess the load on the eG manager and the database. Some other times, they may require a quick summary of the number of managed components within a particular zone/service/segment. To enable such administrators and top-level executives to receive an overview of the managed infrastructure based on chosen criteria, the eG administrative interface provides the MANAGED INFRASTRUCTURE page.
This page appears when the View option is chosen from the Components menu of the Infrastructure tile. The page provides administrators with a quick look at the managed infrastructure as a whole, based on a chosen service / zone / segment.

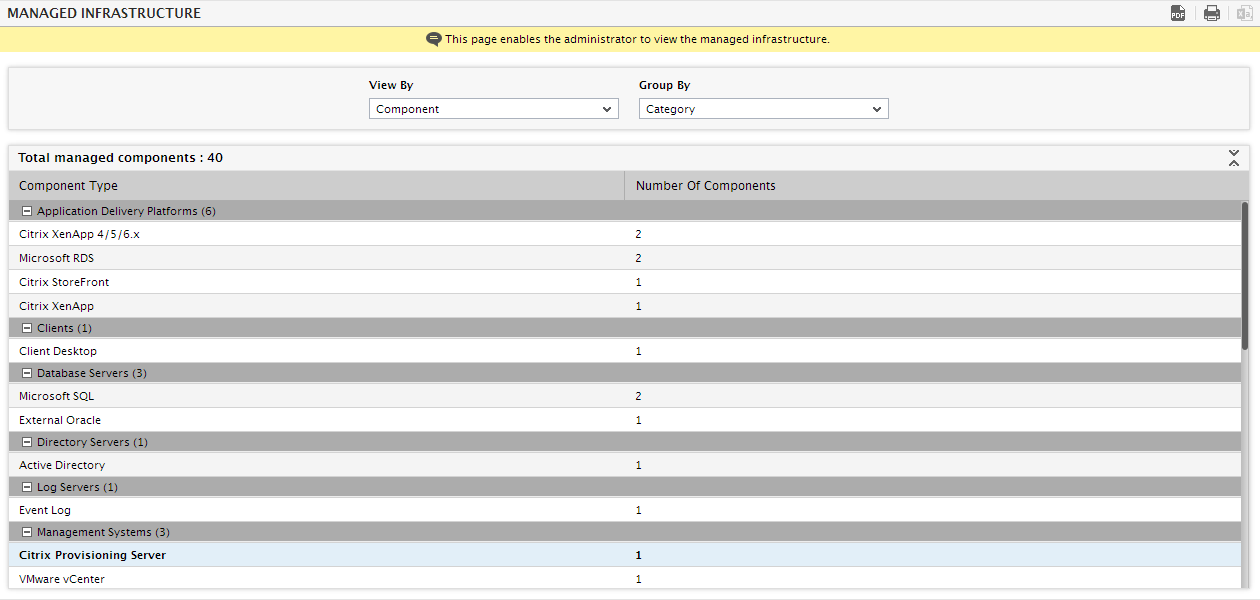
Figure 1 : Viewing the Managed Infrastructure
Once you are in this page, do the following to view the information you require:
-
By default, this page groups the managed components on the basis of component categories and then displays the number of managed components under each component category. Accordingly, by default, the View By list is set to Component and Category is chosen from the Group By list. To view the managed components within a particular service/zone/segment instead, select the corresponding option from the View By list. The impact of this selection on the contents of the page is been discussed below:
- Zone: If you select this option from the View by list, then, you will have to select a particular zone from the Zone list; in this case, this page will display the number and category/type of components that have been included in the given zone.
- Service: If you select this option from the View by list, then, you will have to select a particular service from the Service list; in this case therefore, the page will display the number and category/type of components that are engaged in the delivery of the chosen service.
- Segment: If you select this option from the View by list, then, you will have to select a particular segment from the Segment list; in this case therefore, the page will display the number and category/type of components that are part of the chosen segment.
- If the component list is to be grouped according to a pre-configured component category - eg., Database Servers, Web Servers, Web Application Servers - select Category from the Group By list. To group the resulting component list on the basis of a component-type, select Type from the Group By list. If you want the infrastructure to be grouped according to the component names, then select Name from the Group By list.
-
If you click on a managed component-type displayed under a particular category in Figure 1, then Figure 2 will appear displaying the complete details of every component of that type.

Figure 2 : Viewing the details of the components of a particular type
-
These details include the following:
- The Nick Name of the component;
- The Host IP/Name of the component;
- The Operating System on which the component excutes;
- The System Name - i.e., the name of the system that hosts the component;
- The Component Type;
- The Port at which the component listens, if applicable;
- The sid of the component, if applicable
- Using the icons provided at the right, top corner of the component list, you can print the list, save it as a PDF document, or save it as a CSV file.
-
To know which internal/remote agent and external agent have been assigned to a particular component, click on the Nick Name of that component in Figure 2. This will lead you to Figure 3, where the monitoring details of that component will be displayed.
