Monitoring Apache Flume
eG Enterprise offers a special-purpose monitoring model for the Apache Flume to monitor the status and overall performance of the target Apache Flume .
depicts the layer model of an Apache Flume.
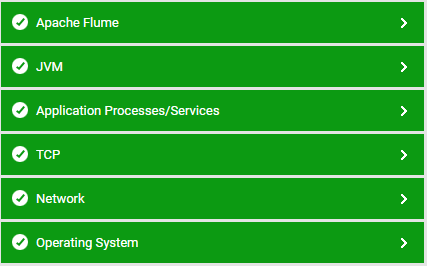
Figure 1 : Layer model for Apache Flume
Every layer in the Figure 1 is mapped to various tests to determine the critical statistics related to the performance of the target Apache Flume. Using the metrics reported by the tests, administrators can find accurate answers for the following performance queries:
-
Are there sufficient number of agents configured to handle the amount of data transfers?
-
Are the Flume instances configured able to handle the type of data generators and storage available?
-
Is Flume source able to write the messages successfully to channel?
-
Is the Flume source able to handle the data events generated by data generators?
-
Are there too many write attempts resulting in failure?
-
Is the maximum channel capacity configured as per amount of data flowing?
-
Is the channel fill percentage optimal at all times?
-
Is channel frequently getting overloaded with events?
-
Is the type of sink appropriate for the long-term storage?
-
Are the batches received by the sink mostly empty?
-
Are Sink's attempt to read events from channel frequently resulting in failure?
-
Is the sink able to create connections quickly if data flow increases?
-
Are the connections getting closed when data flow decreases?
Since the Operating System, Application Processes and TCP layers have been elaborately discussed in Monitoring Unix and Windows Servers document, the tests mapped to the Network Layer have been elaborately discussed in Monitoring Cisco Router document, and the tests mapped to the JVM layer have already been discussed in Monitoring Java Applications document, the sections to come will discuss the other layers in detail.