Monitoring Apache Qpid Broker for Java
eG Enterprise offers a special-purpose monitoring model for the Apache Qpid Java Broker to monitor the status and overall performance of the target Apache Qpid Java Broker.
Figure 1 depicts the layer model of an Apache Qpid Java Broker.
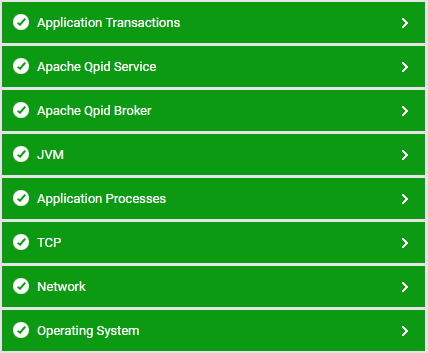
Figure 1 : Layer model for Apache Qpid Java Broker
Every layer in the Figure 1 is mapped to various tests to determine the critical statistics related to the performance of the target Apache Qpid Java Broker. Using the metrics reported by the tests, administrators can find accurate answers for the following performance queries:
-
What is the current state of the application for which the access control rule is applied - Is it active?
-
What is the current state of the authentication that establishes a stable connection with the broker - Is it active?
-
What is the current state of the Broker that provides a proper message transaction - Is it active?
-
Is the count of unused direct memory buffers currently available in the pool of the broker is too high?
-
Are there more objects that are pending for finalization in the broker?
-
Is the CPU load for current/cumulative broker process is high?
-
Is the size of direct/heap memory used by the broker is too low?
-
What is the current state of the broker log files - Is it active?
-
What is the current state of the exchange that receives the messages from the producer and routes them to the queue - Is it active?
-
Is the total size/number of all unrouted messages dropped by the exchange is too high?
-
What is the current state of the port - Is it active?
-
What is the current state of the virtual host - Is it active performing proper messaging service?
-
Is the total size of all messages received/delivered by the virtual host is too low?
-
Is the current count of messaging connections and exchanges on the virtual host is too low?
-
What is the current state of the TCP/IP connection between the broker and the application - Is it active?
-
Are there more transactions that are in open/rolled-back states during TCP/IP connection between the broker and the application?
-
Are there more sessions occurred during TCP/IP connection?
-
Are there more number of messages that are received/delivered by the TCP/IP connection within a transaction?
-
What is the current state of the consumer that receive messages from the queue - Is it active?
-
Are there more number of messages that are unacknowledged by the consumers?
-
What is the current state of the queue - Is it active?
-
Is the size of persistent messages that were enqueued/dequeued is high?
-
Is the size of messages waiting in the queue is high?
-
Are there more number of messages that are expired in the queue?
-
Are there more number of messages that are malformed/unacknowledged in the queue?
Since the Operating System, Application Processes, Windows Service and TCP layers have been elaborately discussed in Monitoring Unix and Windows Servers document, the tests mapped to the Network Layer have been elaborately discussed in Monitoring Cisco Router document, the tests mapped to the Application Transactions layer have been elaborately discussed in Monitoring JBoss EAP Serversdocument and the tests mapped to the JVM layer have already been discussed in Monitoring Java Applications document, the sections to come will discuss the other layers in detail.