Apache Server Status Test
This test reveals critical performance and uptime statistics pertaining to an Apache web server. This test, upon execution, accesses a specific URL on the Apache server, which contains the required metrics. Using this test, administrators can figure out how well the processes are being procesed in the server, how many processes are currently idle, the processes that are in KEEPALIVE and Logging state etc. This way, this test helps administrators to identify processing bottlenecks, if any.
This test is disabled by default. To enable the test, go to the enable / disable tests page using the menu sequence : Agents -> Tests -> Enable/Disable, pick the desired Component type, set Performance as the Test type, choose the test from the disabled tests list, and click on the < button to move the test to the ENABLED TESTS list. Finally, click the Update button.
Target of the test : An Apache web server
Agent deploying this test : An internal agent
Outputs of the test : One set of results for the Apache web server being monitored
| Parameters | Description |
|---|---|
|
Test period |
This indicates how often should the test be executed. |
|
Host |
The host for which the test is to be configured. |
|
Port |
The port to which the specified host listens |
|
URL |
In the this text box, the URL to be accessed by this test for extracting the Apache web server's performance statistics, will be displayed by default. The URL is: http://{Apache web server host}:{Apache web server port}/server-status. |
|
Cookiefile |
Whether any cookies being returned by the web server need to be saved locally and returned with subsequent requests |
|
ProxyHost |
The host on which a web proxy server is running (in case a proxy server is to be used) |
|
ProxyPort |
The port number on which the web proxy server is listening |
|
Proxyusername |
The user name of the proxy server |
|
Proxypassword |
The password of the proxy server |
|
Confirm password |
Confirm the password by retyping it here. |
|
Encoding Type |
Sometimes the eG agent has to parse the URL content with specific encoding other than the default (ISO-8859-1) encoding. In such a case, specify the type of encoding using which the eG agent can parse the URL content in the Encoding text box. By default, this value is none. |
|
Privatekey File Path, Privatekey Password |
SSL-enabled web sites are typically secured by a private key, public key, or a public-private key pair. If the web page configured for this test is SSL-enabled – i.e., if an HTTPS URL is specified against URL – and the contents of this web page can only be accessed using a private key, then the full path to the private key file will have to be provided against Privatekey File Path and the password of the private key file should be specified against Privatekey Password. If no such private key protects the contents of the configured URL, then set the Privatekey File Path and its Privatekey Password to none. |
|
System Properties |
Some web pages (URLs) configured for monitoring may have been designed to allow access for only those requests that have certain specific properties enabled. For instance, web pages of an SSL-enabled web site may have been designed to support TLS v1.3 requests alone. In such a case, you will have to instruct the test to send connection requests to the configured URL over the TLS v1.3 protocol alone; if not, the test will fail. For this, you can use the System Properties parameter. Clicking on the
Figure 1 : Configuring System Properties Specify the request property that the test needs to look up, in the Property text box of Figure 1. In the Value text box, enter the value this property should be set to, so that the eG agent is allowed access to the configured web page. In the case of the above example, you will have to specify -Dhttps.protocol in the Property text box and TLSv1.3 in the Value text box. You can even provide a comma-separated list of values in the Value text box. For example, if the web page supports multiple versions of the TLS protocol, then the Value specification will be: TLSv1.1,TLSv1.2,TLSv1.3. You can even configure more than one Property:Value pair, if the configured URL supports multiple properties. To add another pair, click on the Add More button in Figure 1, Another Property:Value row will appear, where you can provide another system property that the test should use when accessing the given URL. You can delete any Property:Value specification by clicking on the encircled '-' button alongside that specification in Figure 1. To clear all the system properties that have been configured, click on the Clear button in Figure 1. |
|
Include User Agent in Header |
A user agent is a computer program representing a person - for example, a browser in a Web context. Besides a browser, a user agent could be a bot scraping webpages, a download manager, or another app accessing the Web. Along with each request they make to the server, browsers include a self-identifying User-Agent HTTP header called a user agent (UA) string. This string often identifies the browser, its version number, and its host operating system. Some web sites may have been designed to service only those access requests that contain the User Agent (UA) string in the HTTP request header. If this test has been configured with the URL of such a web site/web page, then you have to instruct the test to include the UA string in the header of every connection request it sends to the configured URL; if this is not done, then the test will fail. In this case therefore, set the value of the Include UserAgent in Header flag to true. By default, this flag is set to false, indicating that the requests this test emulates do not contain the UA string by default. |
|
Detailed Diagnosis |
To make diagnosis more efficient and accurate, the eG Enterprise embeds an optional detailed diagnostic capability. With this capability, the eG agents can be configured to run detailed, more elaborate tests as and when specific problems are detected. To enable the detailed diagnosis capability of this test for a particular server, choose the On option. To disable the capability, click on the Off option. The option to selectively enable/disable the detailed diagnosis capability will be available only if the following conditions are fulfilled:
|
 icon corresponding to this parameter will invoke
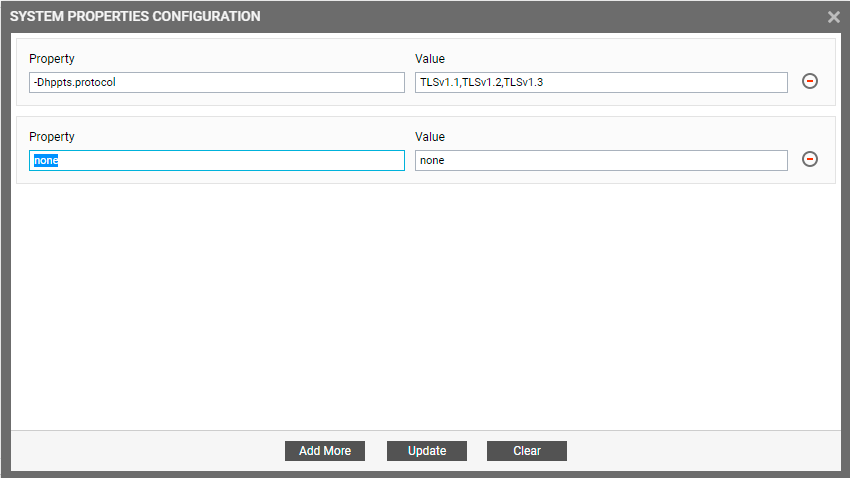
| Measurement | Description | Measurement Unit | Interpretation | ||||||
|---|---|---|---|---|---|---|---|---|---|
|
Total uptime of Apache server |
Indicates the total number of days that the server has been up since its last reboot. |
Days |
Administrators may wish to be alerted if a server has been running without a reboot for a very long period. Setting a threshold for this measure allows administrators to determine such conditions. |
||||||
|
Uptime during the last measure period |
Indicates the time period that the server has been up since the last time this test ran. |
Secs |
If the server has not been rebooted during the last measurement period and the agent has been running continuously, this value will be equal to the measurement period. If the server was rebooted during the last measurement period, this value will be less than the measurement period of the test. For example, if the measurement period is 300 secs, and if the server was rebooted 120 secs back, this metric will report a value of 120 seconds. The accuracy of this metric is dependent on the measurement period - the smaller the measurement period, greater the accuracy. |
||||||
|
Has the server been restarted? |
Indicates whether the server has been rebooted during the last measurement period or not |
|
The values reported by this measure and its corresponding numeric values are mentioned in the table below:
Note: By default, this measure reports the above-mentioned Measure Values to indicate whether the server has been rebooted or not. In the graph of this measure however, the Measure Values are represented using the numeric equivalents only. By checking the time periods when this metric changes from No to Yes, an administrator can determine the times when this server was rebooted. The Detailed Diagnosis of this measure, if enabled, lists the time, shutdown date, reboot date, shutdown duration, and reveals whether the server is in maintenance mode or not. |
||||||
|
Total hits |
Indicates the number of times the server was accessed by users during the last measurement period. |
Number |
|
||||||
|
Data traffic |
Indicates the rate at which data is transmitted by the web server during the last measurement period. |
KB/Sec |
|
||||||
|
CPU usage |
Indicates the prcentage of CPU utilized by the web server during the last measurement period. |
Percent |
If the value of this measure increases with time, it could be a cause for concern. |
||||||
|
Requests rate |
Indicates the rate at which HTTP requests were processed by the web server during the last measurement period. |
Requests/sec |
|
||||||
|
Processing rate of requests |
Indicates the amount of data transferred by the web server per second during the last measurement period. |
KB/sec |
|
||||||
|
Average bytes per request |
Indicates the amount of data transferred by the web server per HTTP request during the last measurement period. |
KB/request |
|
||||||
|
Current requests |
Indicates the number of HTTP requests that are currently being processed by the web server during the last measurement period. |
Number |
|
||||||
|
Idle workers |
Indicates the number of idle Apache processes waiting for an HTTP request during the last measurement period. |
Number |
|
||||||
|
Total server instances |
Indicates the total number of server instances i.e., threads on the web server during the last measurement period. |
Number |
A very high value of this measure could indicate a processing bottleneck. |
||||||
|
Instances waiting for connection |
Indicates the total number of threads that were waiting for a connection during the last measurement period. |
Number |
|
||||||
|
Currently starting instances |
Indicates the number of HTTP requests that were currently processed by the web server during the last measurement period. |
Number |
|
||||||
|
Instances reading requests |
Indicates the number of HTTP requests that were reading the processes of the web server during the last measurement period. |
Number |
|
||||||
|
Instances sending reply |
Indicates the number of HTTP requests that received response from the web server during the last measurement period. |
Number |
|
||||||
|
Instances in keepalive state |
Indicates the number of processes in KEEPALIVE state in the web server during the last measurement period. |
Number |
|
||||||
|
Instances in DNS lookup state |
Indicates the number of requests for which DNS lookup state was enabled during the last measurement period. |
Number |
|
||||||
|
Instances in logging state |
Indicates the number of processes that were in Logging state during the last measurement period. |
Number |
|
||||||
|
Gracefully finishing instances |
Indicates the number of processes that were in gracefully finishing state during the last measurement period. |
Number |
Sometimes after a graceful restart of the Apache server, certain extra processes i.e., the child processes are left running on the server and these processes are deemed to be in gracefully finishing state. These processes remain in this state indefinitely and will not go away until a stop-and-start or a restart is issued on the server. A low value is desired for this measure as frequent restarts to the server may gradually degrade the performance of the server. |