Monitoring the Array Application Delivery Controller
To ensure continuous operation and good health of the Array Application Delivery Controller appliance, eG Enterprise provides a specialized Array Application Delivery Controller model (see Figure 1).
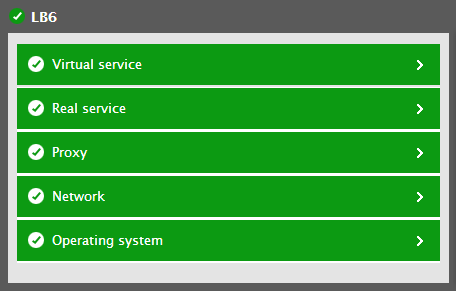
Figure 1 : The layer model of the Array Application Delivery Controller
Every layer of Figure 1 is mapped to collect critical statistics pertaining to its performance. The metrics reported by these tests enable administrators to answer the following questions:
- How well the CPU of the Array Application Delivery Controller has been utilized?
- What is the current state of the fans and is any fan running at abnormal speed?
- What is the current status of the power supplies?
- What is the current health state of each real server and virtual server? How well the real server and virtual server are processing client traffic?
- Which server is handling the maximum traffic?
- How many connections were established to the target delivery controller?
- How many number of requests were processed by the delivery controller per second?
- How many number of SSL connections were accepted by the virtual SSL host?
- How well the client requests are processed by them?
Since the Network layer has been dealt with in the Monitoring IIS Web Servers document, the sections to come will discuss the remaining layers of Figure 1.
