Retrieving Detailed Diagnosis of a Measure
More often than not, administrators may want additional information on a key performance measure. Such additional information is provided as part of detailed diagnosis by eG Enterprise. Using eG REST API, administrators may be able to retrieve the detailed diagnosis of a measure without logging into the eG console. The table below specifies the URL and the parameters that should be used to retrieve the detailed diagnosis of a measure.
URL: http://<eG manager IP:port>/api/eg/analytics/getDiagnosisData
Method: POST
Content-Type: application/json
| Parameters | Key values | Example |
|---|---|---|
|
Header |
managerurl: Base URL of the eG Manager i.e., http://<IP address of the eG console:Port> user: eG username or domain/eG username pwd: Base64 encoded password |
{ "timeline":"1 hour", "componentName":"TEZ-MSSQL-DB:1433", "componentType":"Microsoft SQL", "test":"Network", "measure":"Packet loss", "info":"" } Example to retrieve Detailed Diagnosis for a descriptor of a measure: { "timeline":"1 hour", "server":"Windows_server:win112:NULL", "test":"Disk Activity", "descriptor":"Disk0 C:", "measure":"Disk busy" } |
|
Body |
Default: { "timeline":"Timeline for retrieving the measure data (in Latest/hours/days/weeks/months/Any)", "componentName":"Hostname of the component:Port/Null", "componentType":"Component Type", "test":"Test name", "measure":"Measure name", "info":"Descriptor name", 'showDisplayName":"true/false", "startDate": "<Month Date,YYYY HH:MM:SS>", "endDate": "<Month Date,YYYY HH:MM:SS>" } For an Oracle Database server, the Key values should be specified as follows: { "timeline":"Timeline for retrieving the measure data (in Latest/hours/days/weeks/months/Any)", "componentName":"Hostname of the component:Port:SID", "componentType":"Component Type", "test":"Test name", "measure":"Measure name", "info":"Descriptor name", "showDisplayName":"true/false", "startDate": "<Month Date,YYYY HH:MM:SS>", "endDate": "<Month Date,YYYY HH:MM:SS>" } |
Note:
-
The "info" key value is mandatory for non-descriptor based tests too. In such case, the key value should be blank as shown in the example.
-
The startDate and endDate should be specified only if you set the timeline parameter to Any.
-
If you do not specify the timeline parameter, then, the default timeline that this API will use is 1 hour.
| Type | Code | Content |
|---|---|---|
|
JSON |
200 |
[ { "HOP COUNT": "1", "ROUTER": "*", "measurementTime": "Jan 13, 2026 16:07:34", "HOP DELAYS(MS)": "*;*;*" }, . . . } ] |
| Type | Code | Content |
|---|---|---|
|
JSON |
401 UNAUTHORIZED |
{"code": 401,"error": "Invalid username or password"} |
|
JSON |
400 BAD REQUEST |
You may receive one of the following responses: {"code": 400,"error": " Bad Request. Header parameters : Username or Password or Manager Url is missing"} (or) {"code": 400,"error": " Bad Request. Manager Url,Username,password is not provided"} (or) {"code": 400,"error": " Bad Request. Please refer EG REST API documentation and add required parameters for this API."} (or) {"code": 400,"error": "Component Name or Component Type or Measure or Test or Timeline is not provided"} (or) {"code": 400,"error": "Component not associated with this user"} (or) {"code": 400,"error": "No components associated for this user"} (or) {"code": 400,"error": "Provide a space between value and unit in Timeline"} (or) {"code": 400,"error": "The test is not available with this component type"} (or) {"code": 400,"error": "Invalid Timeline. Please refer EG REST API documentation for this API"} |
|
JSON |
500 Server Error |
{"code": 500,"error": " Server Error. Please check /manager/logs/error_log in the installation directory for more information"} |
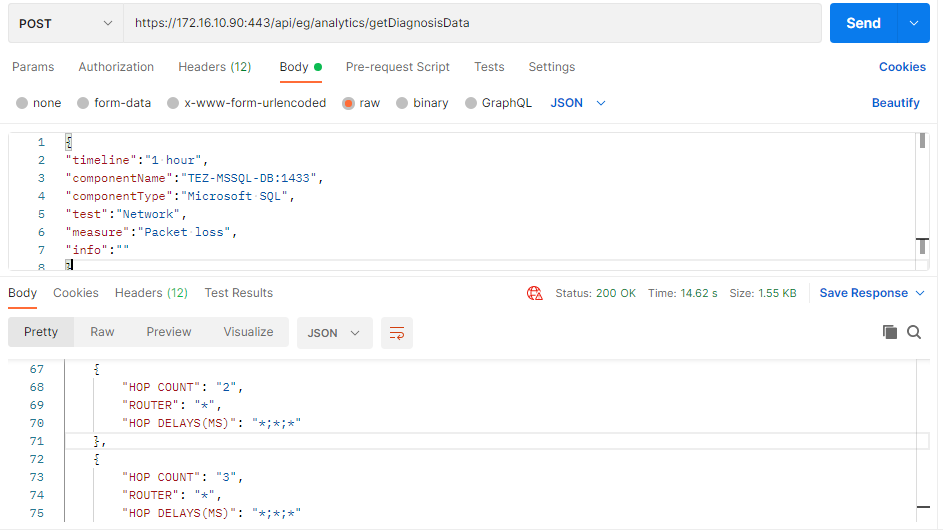
Figure 1 : Retrieving detailed diagnosis of a measure using Postman REST Client
Retrieving Detailed diagnosis of a Measure using cURL
To retrieve the detailed diagnosis of a measure using cURL, the command should be specified in the following format:
curl -L -X POST "http://<eG Manager IP:Port>/api/eg/analytics/getDiagnosisData" -H "user:<eG username or domain/eG username>" -H "pwd:Base64 encoded password" -H "managerurl:http://<eG Manager IP:Port>" -H "Content-Type:application/json" --data-raw "{\"timeline\":\"Timeline for retrieving the detailed diagnosis data (in hours/days/weeks)\",\"componentType\":\"Component Type\",\"componentName\":\"Component name:Port\",\"test\":\"Test name\",\"measure\":\"Measure name\",\"info\":\"Descriptor name\"}"
Figure 2 shows an example of retrieving the detailed diagnosis of a measure using cURL.
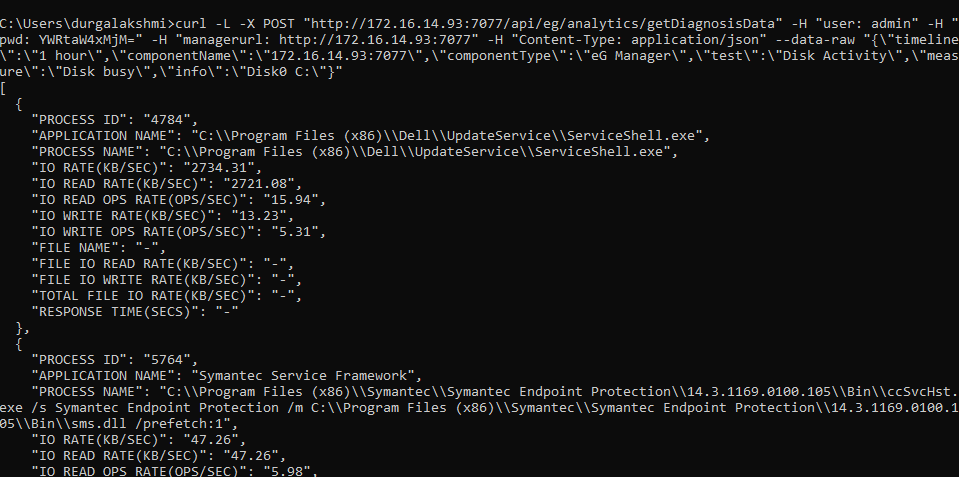
Figure 2 : Retrieving Detailed diagnosis of a measure using cURL