Retrieving Details of Current Alarms Raised in the Target Environment
By default, using the eG REST API, administrators can retrieve the count of current alarms raised in the eG manager as well as the detailed current alarms raised in the eG manager. The URL to retrieve the detailed current alarms should be in the following format:
URL:http://<eG manager IP:port>/api/eg/analytics/getAlerts
Method: POST
Content-Type: application/json
| Parameters | Key values | Example |
|---|---|---|
|
Headers |
managerurl: Base URL of the eG Manager i.e., http://<IP address of the eG console:Port> user: eG username or domain/eG username pwd: Base64 encoded password |
{ "filterBy": "zone", "filterValues": "SEN-SQL.Zone" } |
|
Body |
Default: { "filterBy":"<zone/segment/service/componentType>", "filterValues":"<comma-separated list of zone/segment/service/componentType>" }
|
| Type | Code | Example Response |
|---|---|---|
|
JSON |
200 |
{ "total": 12, "summary": [ { "critical": 3, "color": "#cd0f0f" }, { "major": 7, "color": "#fa9d1c" }, { "minor": 2, "color": "#ccc100" } ], "data": [ { "priority": "critical", "componentType": "Microsoft SQL", "componentName": "SQL_10.36:1433", "description": " TCP connection could not be established to port 1433 for Microsoft SQL SQL_10.36:1433", "test": "TCP Port Status", "measure": "Availability", "layer": "Application Processes", "startTime": "Sep 01, 2022 16:37", "service": "SENTHIL-Database.Services.ALL" }, . . . ], "errorMsg": "-" } |
| Type | Code | Content |
|---|---|---|
|
JSON |
401 UNAUTHORIZED |
{"code": 401,"error": "Invalid username or password"} |
|
JSON |
400 BAD REQUEST |
You may receive one of the following responses: {"code": 400,"error": " Bad Request. Header parameters : Username or Password or Manager Url is missing"} (or) {"code": 400,"error": " Bad Request. Manager Url,Username,password is not provided"} (or) {"code": 400,"error": " Bad Request. Please refer EG REST API documentation and add required parameters for this API"} (or) {"code": 400,"error": "filterBy or filterValues is not provided"} (or) {"code": 400,"error": "Invalid value for FilterBy"} |
|
JSON |
500 Server Error |
{"code": 500,"error": " Server Error. Please check /manager/logs/error_log in the installation directory for more information"} |
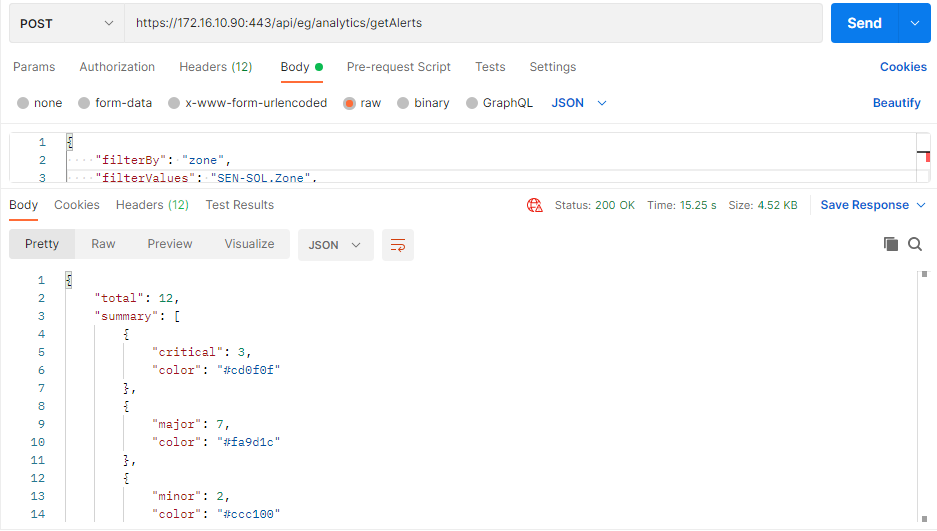
Figure 1 : Example to retrieve detailed current alarms using Postman REST Client
Retrieving Details of Current Alarms Raised in the Target Environment using cURL
To retrieve the details of current alarms in the target environment using cURL, the command should be specified in the following format:
curl -L -X POST "http://<eG Manager IP:Port>/api/eg/analytics/getAlerts" -H "user:<eG username or domain/eG username>" -H "pwd:Base64 encoded password" -H "managerurl:http://<eG Manager IP:Port>" -–data-raw "{\"filterBy\":\"zone/serivce/segment/componentType\",\"filterValues\": \"comma-separated list of zone/service/segment/componentType\"}" -H "Content-Type:application/json"
Figure 2 shows an example of retrieving the details of current alarms raised in the target environment using cURL.
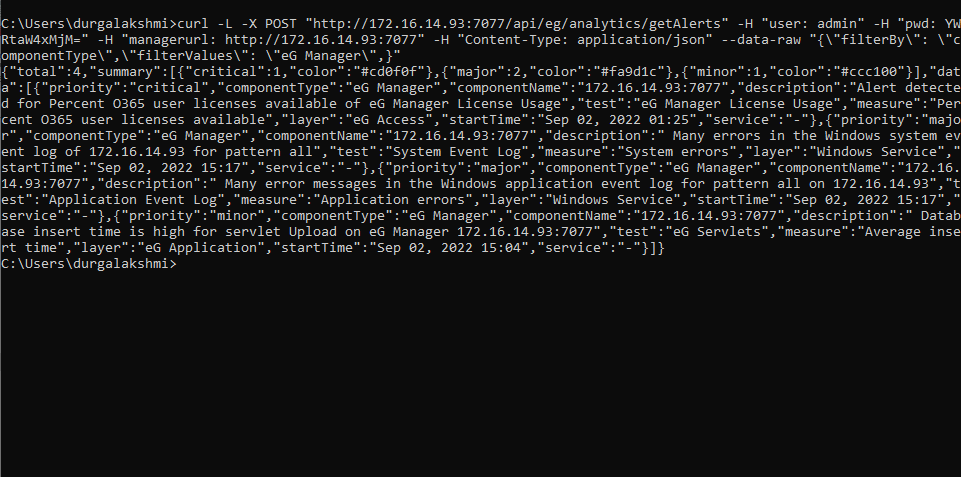
Figure 2 : Retrieving the details of current alarms in the target environment using cURL