Retrieving Trend Data
Using the eG REST API, administrators can retrieve the trend data of the tests across all relevant component types.
Note:
Note that this API retrieves the data from the eG backend database and displays in the same format as stored in the database. If you wish to retrieve the trend data in a processed format, you can use the following APIs:
Retrieving Hourly Trend Data
Retrieving Daily Trend Data
Retrieving Monthly Trend Data
The table below specifies the URL and the parameters that should be used to retrieve the measures of the tests.
URL: http://<eG manager IP:port>/api/eg/analytics/getTrendData
Method: POST
Content-Type: application/json
| Parameters | Key values | Example |
|---|---|---|
|
Headers |
managerurl: Base URL of the eG Manager i.e., http://<IP address of the eG console:Port> user: eG username or domain/eG username pwd: Base64 encoded password |
{ "test":"Disk Activity", "measure":"Disk busy, Disk read time", "showData":"Trend", "period":"Monthly", "trendType":"Average" } |
|
Body |
Default: { "test":"Test name", "componentName":"Hostname of the component:Port", "showData":"Trend", "period":"Hourly/Daily/Monthly", "trendType":"Maxmin/Average/Sum" } |
|
|
Optional: { "startDate":"start_date (YYYY-MM-DD Hours:Minutes:Seconds)", "endDate":"end_date(YYYY-MM-DD Hours:Minutes:Seconds)", "measure":"comma-separated list of measures", "msmthost":"Measurement Host", "segment":"Segment Name", "service":"Service Name", "filterInfo":"Info", "groupby":"measure", "orderby":"Ascending/Descending", "info":"info" } |
| Type | Code | Content |
|---|---|---|
|
JSON |
200 |
[ "TRGT_HOST PORT_NO SITE_NAME INFO MSMT_HOST MSMT_TIME ", "172.16.14.93 NULL NULL +Disk0 C: D: E: 172.16.14.93 2022-04-25 00:00:00 ", "TEZWIN19O365 NULL NULL +Disk0 C: TEZWIN19O365 2022-04-25 00:00:00 ", "172.16.14.93 NULL NULL +Disk0 C: D: E: 172.16.14.93 2022-04-25 00:00:00 ", "TEZWIN19O365 NULL NULL +Disk0 C: TEZWIN19O365 2022-04-25 00:00:00 ", "TEZWIN19O365 NULL NULL +Disk0 C: TEZWIN19O365 2022-04-25 13:00:00 ", "TEZWIN19O365 NULL NULL +Disk0 C: TEZWIN19O365 2022-04-25 13:00:00 ", "172.16.14.93 NULL NULL +Disk0 C: D: E: 172.16.14.93 2022-04-25 14:00:00 ", . . . ] |
| Type | Code | Content |
|---|---|---|
|
JSON |
401 UNAUTHORIZED |
{"code": 401,"error": "Invalid username or password"} |
|
JSON |
400 BAD REQUEST |
You may receive one of the following responses: {"code": 400,"error": "Bad Request. Header parameters : Username or Password or Manager URL is missing"} (or) {"code": 400,"error": "Bad Request. Header parameters : Manager URL, Username or Password is not provided"} (or) {"code": 400,"error": "No components associated for this user "} |
|
JSON |
500 Server Error |
{"code": 500,"error": " Server Error. Please check /manager/logs/error_log in the installation directory for more information."} |

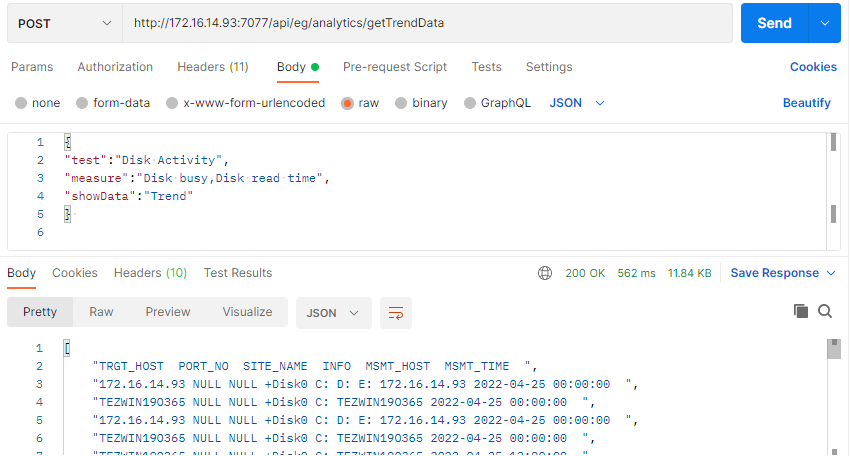
Figure 1 : Retrieving trend data of a chosen measure using Postman REST Client
Retrieving Trend Data using cURL
To retrieve trend data of the tests using cURL, the command should be specified in the following format:
curl -L -X POST "http://<eG Manager IP:Port>/api/eg/analytics/getTrendData" -H "user:<eG username or domain/eG username>" -H "pwd:Base64 encoded password" -H "managerurl:http://<eG Manager IP:Port>" -H"Content-Type:application/json" --data-raw "{\"test\":\"Test name\",\"componentName\":\"Name of Component\",\"info\":\"Descriptor name\",\"measure\":\"comma-separated list of measures\",\"showData\":\"Trend\",\"period\":\"Hourly/Daily/Monthly\",
\"trendType\":\"Maxmin/Average/Sum\"}"
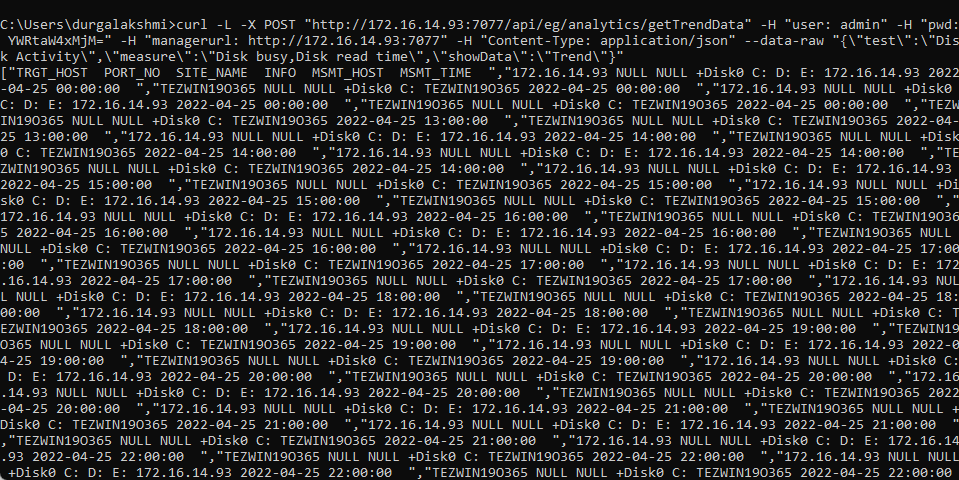
Figure 2 shows an example to retrieve the trend data for the measures of a chosen test using cURL.

Figure 2 : An example cURL command to retrieve the trend data for the measures
Figure 3 shows a sample output that retrieves the trend data for the chosen measures of a chosen test reported by eG Enterprise using cURL.

Figure 3 : Sample output with the trend data for the chosen measures of a chosen test