Retrieving the History of Alarms Raised in the Target Environment
By default, using the eG REST API, administrators can retrieve the history of alarms raised in the eG manager. The URL to retrieve the history of alarms should be in the following format:
URL:http://<eG manager IP:port>/api/eg/analytics/getAlarmsHistory
Method: POST
Content-Type: application/json
| Parameters | Key values | Example |
|---|---|---|
|
Headers |
managerurl: Base URL of the eG Manager i.e., http://<IP address of the eG console:Port> user: eG username or domain/eG username pwd: Base64 encoded password |
Example to retrieve History of Alarms with none of the Optional parameters: { } Example to retrieve History of Alarms: { "componentName": "172.16.10.90:443", "componentType": "eG Manager", "startDate": "Aug 30, 2021 22:00:00", "endDate": "Aug 31, 2021 1:00:00", "priority": "", "orderby": "Component Name", "showAcknowledgements": "No" } Example to retrieve History of Alarms when timeline is set to Any: { "componentName": "172.16.10.90:443", "componentType": "eG Manager", "timeline": "Any", "startDate": "Aug 30, 2021 22:00:00", "endDate": "Aug 31, 2021 1:00:00", "priority": "", "orderby": "Component Name", "showAcknowledgements": "No" } |
|
Body |
Optional: { "componentType":"Component Type", "componentName": "Hostname of the component:Port", "timeline="<timeline in hours/days/weeks/minutes or Any>", "orderby":"<Start Time or Component Name>", "showAcknowledgements": "Yes/No", "priority": "All or Critical & Major or Critical or Major or Minor", "startDate": "<Month Date,YYYY HH:MM:SS>", "endDate": "<Month Date,YYYY HH:MM:SS>" } |
Note:
-
This API does not require any default parameters and hence, can be executed with an empty JSON.
-
The startDate and endDate should be specified only if you set the timeline parameter to Any.
-
If you do not specify the timeline parameter, then, the default timeline that this API will use is 1 hour.
-
If you do not specify the showAcknowledgements parameter, then, by default, it is set to Yes.
-
If you do not specify the priority parameter, then, this API will use the All option for the priority, by default.
-
If you do not specify the orderby parameter, then, this API will use the Start time of the alarm, by default.
| Type | Code | Example Response |
|---|---|---|
|
JSON |
200 |
{ "summary": { "total": 457, "critical": 211, "major": 76, "minor": 170 }, "problemDetails": [ { "priority": "Major", "layer": "eG Application", "measure": "Recent messages", "componentType": "eG Manager", "componentName": "172.16.10.90:443", "service": "-", "test": "eG Manager Error Log", "description": " Many recent errors in the error_log of eG Manager 172.16.10.90:443", "startTime": "Sep 01, 2022 22:20", "duration": "4m 57s" }, { "priority": "Minor", "layer": "eG Application", "measure": "Recent messages", "componentType": "eG Manager", "componentName": "172.16.10.90:443", "service": "-", "test": "eG Manager Error Log", "description": " Many recent warnings in the error_log of eG Manager 172.16.10.90:443", "startTime": "Sep 01, 2022 19:30", "duration": "9m 57s" }, { "priority": "Critical", "layer": "eG Application", "measure": "Recent messages", "componentType": "eG Manager", "componentName": "172.16.10.90:443", "service": "-", "test": "eG Manager Error Log", "description": " Many recent errors in the error_log of eG Manager 172.16.10.90:443", "startTime": "Sep 01, 2022 21:46", "duration": "4m 16s" }, { "priority": "Critical", "layer": "eG Application", "measure": "Recent messages", "componentType": "eG Manager", "componentName": "172.16.10.90:443", "service": "-", "test": "eG Manager Error Log", "description": " Many recent errors in the error_log of eG Manager 172.16.10.90:443", "startTime": "Sep 01, 2022 20:50", "duration": "5m 5s" }, { "priority": "Minor", "layer": "eG Application", "measure": "Files updated", "componentType": "eG Manager", "componentName": "172.16.10.90:443", "service": "-", "test": "File Updates", "description": " Many files updated recently", "startTime": "Sep 01, 2022 19:42", "duration": "Current" }, . . . . . ] } |
| Type | Code | Content |
|---|---|---|
|
JSON |
401 UNAUTHORIZED |
{"code": 401,"error": "Invalid username or password"} |
|
JSON |
400 BAD REQUEST |
You may receive one of the following responses: {"code": 400,"error": " Bad Request. Header parameters : Username or Password or Manager Url is missing"} (or) {"code": 400,"error": " Bad Request. Manager Url,Username,password is not provided"} (or) {"code": 400,"error": " Invalid value for ShowAcknowledgements. Please refer EG REST API documentation for this API"} (or) {"code": 400,"error": "Invalid Priority. Please refer EG REST API documentation for this API"} (or) {"code": 400,"error": "Invalid value for Orderby. Please refer EG REST API documentation for this API"} (or) {"code": 400,"error": "Provide a space between value and unit in Timeline"} (or) {"code": 400,"error": "Invalid Timeline. Please refer EG REST API documentation for this API."} (or) {"code": 400,"error": "Timeline range is 1 to 59, if timeline unit is minutes."} (or) {"code": 400,"error": "Bad Request. Please give start date and end date if timeline is Any. Please refer API documentation."} (or) {"code": 400,"error": "Invalid date format for startdate. Please refer EG REST API documentation for this API"} (or) {"code": 400,"error": "Invalid date format for enddate. Please refer EG REST API documentation for this API"} (or) {"code": 400,"error": "Start date should be lesser than end date"} (or) |
|
JSON |
500 Server Error |
{"code": 500,"error": " Server Error. Please check /manager/logs/error_log in the installation directory for more information"} |
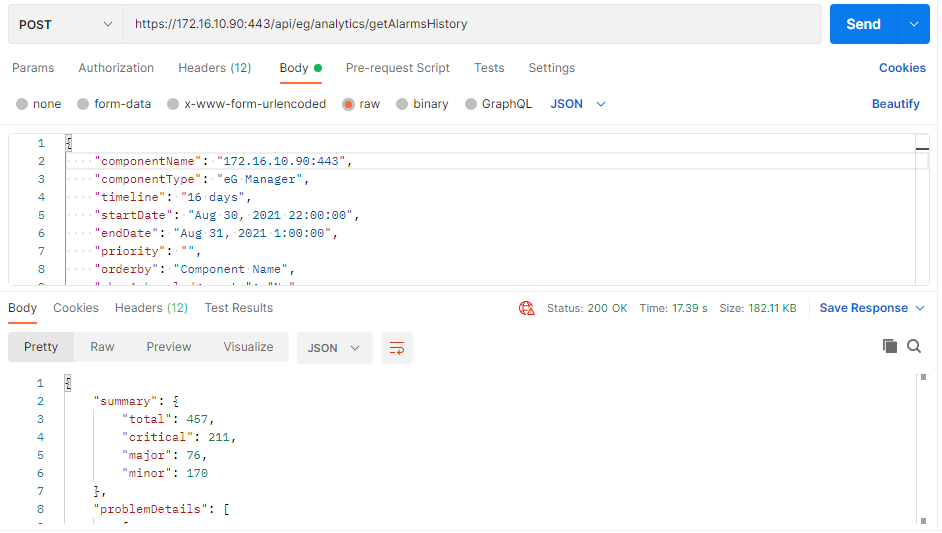
Figure 1 : Example to retrieve the history of alarms using Postman REST Client
Retrieving History of Alarms Raised in the Target Environment using cURL
To retrieve the history of alarms in the target environment using cURL, the command should be specified in the following format:
curl -L -X POST "http://<eG Manager IP:Port>/api/eg/analytics/getAlarmsHistory" -H "user:<eG username or domain/eG username>" -H "pwd:Base64 encoded password" -H "managerurl:http://<eG Manager IP:Port>" -H "Content-Type: application/json" --data-raw "{\"componentName\": \"name of Component:Port\",\"componentType\": \"Component Type\",\"timeline\": \"Timeline for retrieving the alarms (in hours/days/weeks/minutes/Any)\",\"startDate\": \"start date\",\"endDate\": \"end Date\",\"priority\": \"All or Critical & Major or Critical or Major or Minor\",\"orderby\": \"Component Name or Start Time\",\"showAcknowledgements\": \"Yes/No\"}"
Figure 2 shows an example command to retrieve the history of alarms raised in the target environment using cURL.
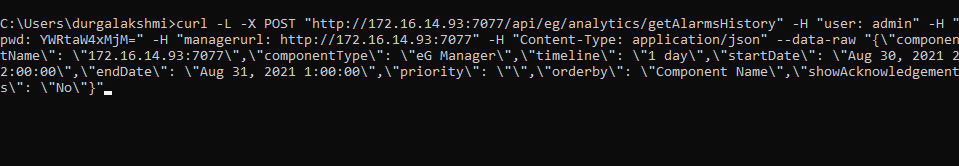
Figure 2 : An example command to retrieve history of alarms using cURL
Figure 2 shows a sample history of alarms retrieved from the target environment using cURL.
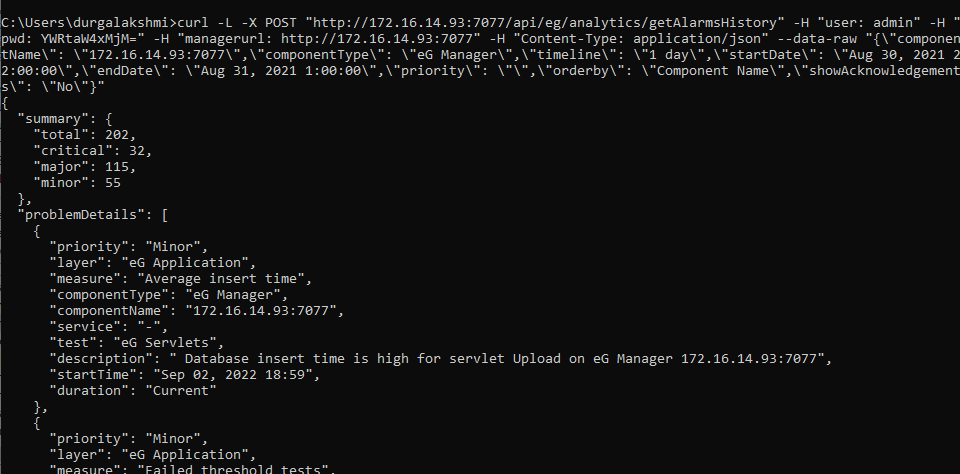
Figure 3 : A sample history of alarms retrieved from the target environment using cURL