Disk Activity - AVD Test
This test reports statistics pertaining to the input/output utilization of each physical disk on the chosen User/Desktop.
Target of the test : An Azure Virtual Desktop
Agent deploying the test : An internal agent.
Outputs of the test : One set of results for each disk partition supported by the chosen User/Desktop
| Parameters | Description |
|---|---|
|
Test Period |
How often should the test be executed. |
|
Host |
The host for which the test is to be configured. |
|
Port |
The default port is NULL. |
|
Disks |
The Disks parameter lets you to choose the type of disks that you want to monitor. By default, Physical will be selected from the Disks list box indicating that this test will monitor the physical disks in the chosen Azure virtual desktop. However, you can override this setting as per your requirement. If you want to monitor the logical disks on the virtual desktop, choose Logical from the Disks list box. Likewise, selecting All from the list box will help you to monitor both physical and logical disks on the selected Azure virtual desktop. |
|
UseExe |
Setting the UseExe flag to true, ensures that the disk activity metrics are collected by executing a binary instead of dynamically linking to the Performance instrumentation library. By default, this is set to false. |
|
Trace |
By default, this flag is set to No. This indicates that, by default, the detailed diagnosis of the test provides only high-level insights into the I/O load imposed on a disk partition in a virtual desktop. These default insights help administrators identify the I/O-intensive applications running on a virtual desktop, but they do not pinpoint the precise file that experienced the maximum reads/writes. For granular, file-level insights into I/O load and usage, you need to set the Trace flag to Yes. Note: Setting the Trace flag to Yes will cause eG Enterprise to collect and store read/write metrics pertaining to every file stored in the disk partition. This can increase the strain on the eG database. Therefore, it is recommended that you turn on the Trace flag only after ensuring that the eG database is well-sized and well-tuned. |
|
Read Size in KB |
This parameter is applicable only when the Trace flag is set to Yes and the Disk Busy measure violates the value specified against the “Disk Busy Percent” parameter. By default, the value of this parameter is set to 10 KB. This indicates that the detailed diagnosis of this test will include the details of only those files from which data of size greater than or equal to 10 KB has been read. This setting helps you identify the files from which maximum data was read. However, you can override the default value of this parameter as per your requirement. |
|
Write Size in KB |
This parameter is applicable only when the Trace flag is set to Yes and the Disk Busy measure violates the value specified against the “Disk Busy Percent” parameter. By default, the value of this parameter is set to 10 KB. This indicates that the detailed diagnosis of this test will include the details of only those files to which data of size greater than or equal to 10 KB has been written. This setting will help you to identify the files to which maximum amount of data was written. However, you can override the default value of this parameter as per your requirement. |
|
Disk Response Time Secs |
This parameter is applicable only when the Trace flag is set to Yes and the Disk Busy measure violates the value specified against the “Disk Busy Percent” parameter. By default, the value of this parameter is set to 1 second. This indicates that the detailed diagnosis of this test will include the details of only those files that took longer than 1 second to read and write data of size specified against the Read Size in KB and Write Size in KB parameters. This setting will help you to identify the files that took the maximum time to respond to read/write requests. However, you can override the default value of this parameter as per your requirement. |
|
Event Capture Interval in Secs |
This parameter is applicable only when the Trace flag is set to Yes and the Disk Busy measure violates the value specified against the “Disk Busy Percent” parameter. By default, the value of this parameter is set to 10 seconds. This setting ensures that the detailed diagnosis of the test reports on only those disk events that were performed during the last 10 seconds of a measurement period. However, you can override the default value of this parameter as per your requirement. Also, the detailed diagnosis of this test will report on only those files that fulfill all the following criteria:
|
|
Disk Busy Percent |
This parameter is applicable only when the Trace flag is set to Yes. Specify the percentage of time beyond which the disk partition should be in use for this test to report detailed diagnosis for the Disk Busy measure. By default, this parameter is set to 20. This means that, by default, the Disk Busy measure of this test will report detailed diagnostics only for those disk partitions that have been busy for more than 20% of the time. You can override this value as per your requirement. |
|
Ignore Non Local |
|
|
Detailed Diagnosis |
To make diagnosis more efficient and accurate, the eG Enterprise embeds an optional detailed diagnostic capability. With this capability, the eG agents can be configured to run detailed, more elaborate tests as and when specific problems are detected. To enable the detailed diagnosis capability of this test for a particular server, choose the On option. To disable the capability, click on the Off option. The option to selectively enable/disable the detailed diagnosis capability will be available only if the following conditions are fulfilled:
|
| Measurement | Description | Measurement Unit | Interpretation |
|---|---|---|---|
|
Disk busy |
Indicates the percentage of elapsed time during which this disk was busy processing requests (i.e., reads or writes). |
Percent |
Comparing the percentage of time that the different disks are busy, an administrator can determine whether the application load is properly balanced across the different disks. The detailed diagnosis of this measure will reveal the top-10 I/O-intensive applications/processes executing on the virtual desktop. If the Trace parameter of the test is set to Yes, then the detailed diagnostics will additionally display I/O usage metrics per file stored in the disk partition. The files included in the detailed diagnosis will be the ones that fulfill the following criteria:
|
|
Disk busy due to reads |
Indicates the percentage of elapsed time that the selected disk drive is busy servicing read requests. |
Percent |
|
|
Disk busy due to writes |
Indicates the percentage of elapsed time that the selected disk drive is busy servicing write requests. |
Percent |
|
|
Disk read time |
Indicates the average time in seconds of a read of data from the disk. |
Secs |
|
|
Disk write time |
Indicates the average time in seconds of a write of data from the disk. |
Secs |
|
|
Avg queue length |
Indicates the average number of both read and write requests that were queued for the selected disk during the sample interval. |
Number |
Using the detailed diagnosis of this measure, you can isolate the exact application and process on the virtual desktop that has the highest level of read/write activity. |
|
Current disk queue length |
The number of requests outstanding on the disk at the time the performance data is collected. |
Number |
This measure includes requests in service at the time of the snapshot. This is an instantaneous length, not an average over the time interval. Multi-spindle disk devices can have multiple requests active at one time, but other concurrent requests are awaiting service. This counter might reflect a transitory high or low queue length, but if there is a sustained load on the disk drive, it is likely that this will be consistently high. Requests experience delays proportional to the length of this queue minus the number of spindles on the disks. This difference should average less than two for good performance. |
|
Disk read rate |
Indicates the number of reads happening on a logical disk per second. |
Reads/Sec |
A dramatic increase in this value may be indicative of an I/O bottleneck on the server. |
|
Data read rate from disk |
Indicates the rate at which bytes are transferred from the disk during read operations. |
KB/Sec |
A very high value indicates an I/O bottleneck on the server. |
|
Disk write rate |
Indicates the number of writes happening on a local disk per second. |
Writes/Sec |
A dramatic increase in this value may be indicative of an I/O bottleneck on the server. |
|
Data write rate to disk |
Indicates the rate at which bytes are transferred from the disk during write operations. |
KB/Sec |
A very high value indicates an I/O bottleneck on the server. |
|
Disk service time |
Indicates the average time that this disk took to service each transfer request ( i.e., the average I/O operation time) |
Secs |
A sudden rise in the value of this measure can be attributed to a large amount of information being input or output. A consistent increase however, could indicate an I/O processing bottleneck. |
|
Disk queue time |
Indicates the average time that transfer requests waited idly on queue for this disk. |
Secs |
Ideally, the value of this measure should be low. |
|
Disk I/O time |
Indicates the avarage time taken for read and write operations of this disk. |
Secs |
The value of this measure is the sum of the values of the Disk service time and Disk queue time measures. A consistent increase in the value of this measure could indicate a latency in I/O processing. |
|
Avg IO read size |
Indicates the average number of bytes transferred from disk during read operations. |
KB |
Larger I/Os tend to have higher latency (for example, BACKUP/RESTORE operations issue 1 MB transfers by default). |
|
Avg IO write size |
Indicates the average number of bytes transferred into disk during write operations. |
KB |
|
|
Split IO |
Reports the rate at which the operating system divides I/O requests to the disk into multiple requests. |
Splits/Sec |
A split I/O request might occur if the program requests data in a size that is too large to fit into a single request or if the disk is fragmented. Factors that influence the size of an I/O request can include application design, the file system, or drivers. A high rate of split I/O might not, in itself, represent a problem. However, on single-disk systems, a high rate for this counter tends to indicate disk fragmentation. |
The detailed diagnosis of the Disk busy measure, if enabled, provides information such as the Process IDs executing on the disk, the application names, the rate at which I/O read and write requests were issued by each of the applications, and the rate at which data was read from and written into the disk by each of the applications. In the event of excessive disk activity, the details provided in the detailed diagnosis page will enable users to figure out which application is performing the I/O operation that is keeping the disk busy. If the Trace flag of this test is set to Yes, then the detailed diagnosis will also provide file-level insights into I/O activity. Whenever disk activity is abnormally high, you can use these details to accurately identify the file that experienced the highest level of I/O activity in terms of the amount of data read from and written to. Likewise, if users complain of I/O processing latencies, these additional details will point you to the exact file that is the slowest in responding to I/O requests.
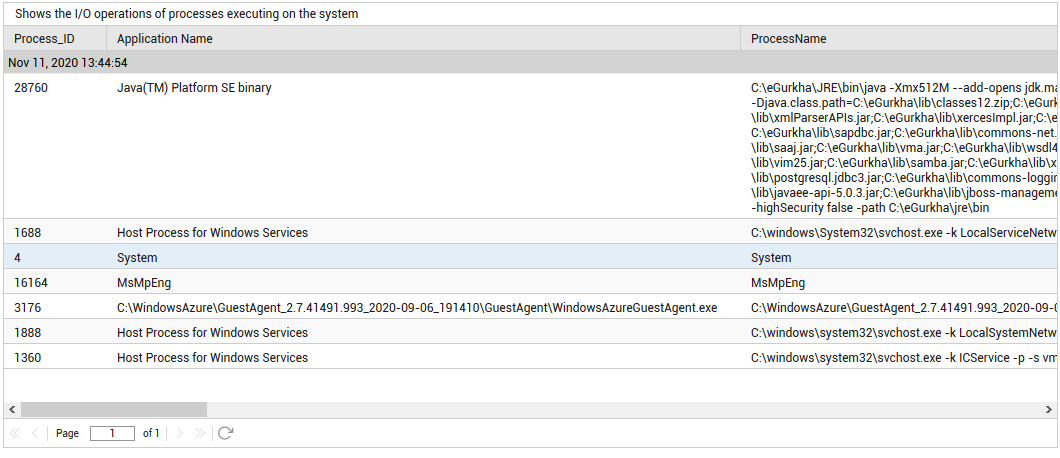
Figure 1 : The detailed diagnosis of the Disk busy measure