Monitoring AVD Host Pools
eG Enterprise offers a specialized Microsoft AVD Host Pool model out-of-the-box, for monitoring the load, configuration, and usage of virtual desktops in a target host pool. With the metrics reported by the model, administrators can find quick and accurate answers to the following:
-
Is any session host not registered with the Azure Virtual Desktop service?
-
Did any session host experience an unscheduled reboot recently?
-
Is any session host running out of disk, CPU, memory, or GPU resources? Which application on the host is draining the resources? Which user is accessing such applications?
-
Are TCP connects to any session host dropping frequently?
-
Is any session host seeing an unusually high rate of TCP reransmissions?
-
Have launching delays been noticed on any application on a session host?
-
Were any critical errors/warnings captured by the event logs on any session host?
-
Did the security logs on any session host reveal security audit failures?
-
Did any sessions to a host disconnect recently?
-
Have any sessions to a host been idle for too long a time? Which user's sessions are these?
-
Are any sessions down currently?
-
Is the logon performance of any user, poor? If so, what is causing the logon delay - is it a delay in authentication? or slowness in group policy processing? If group policy is causing the delay, then which client-side extension associated with which group policy is contributing to it?
-
Which user's overall experience with the session host, sub-par? What is the cause of the poor experience - abnormal resource usage? I/O latencies? memory leaks? user input delays?
To access these metrics, do the following:
-
Login to the eG monitoring console.
-
Close the Alarms window that pops up to focus on the Monitor Dashboard.
-
In the Components At-A-Glance section of the Monitor Dashboard, locate the bar graph representing the number of Microsoft AVD Host Pools that are being monitored and their current state.
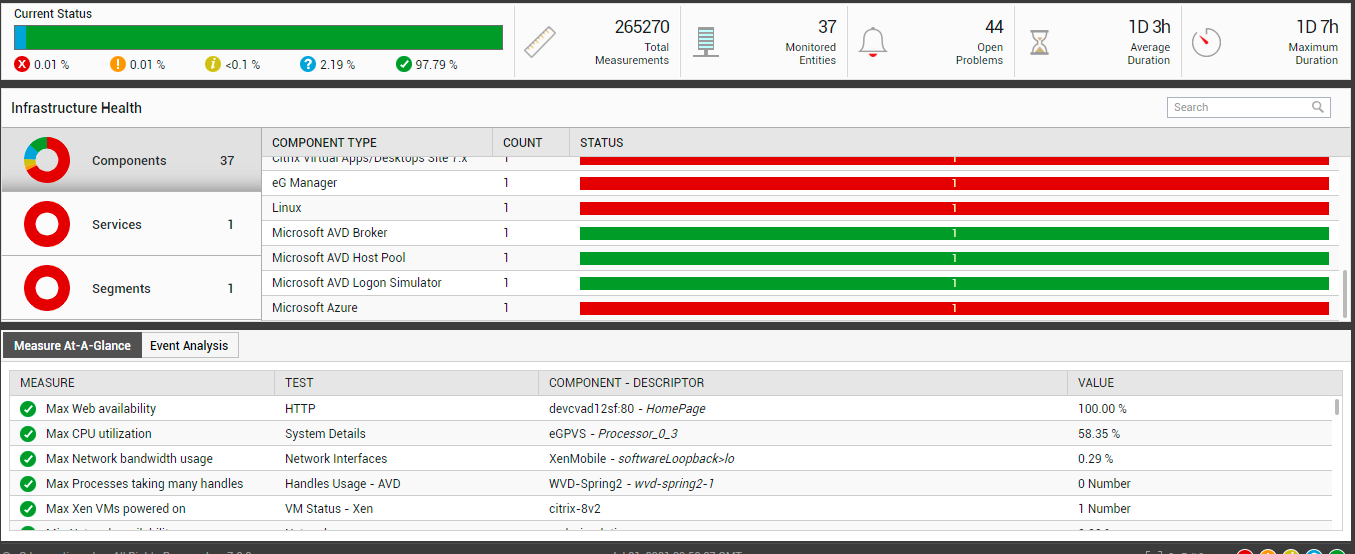
Figure 28 : The Monitor Dashboard
-
Click on a division (denoting a state) in the bar to know which host pools are in that particular state. If only one host pool is managed, then the bar will represent the current state of that host pool alone. In this case, clicking on the bar will open Figure 29, displaying the session hosts / Azure Virtual Desktops in the pool that you clicked on, and the health of each session host.
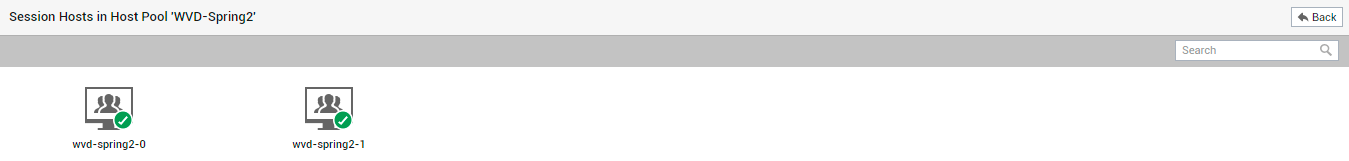
Figure 29 : The Session Hosts in an AVD host pool and the health of each session host
-
Click on a pool in Figure 29 to zoom into its performance.
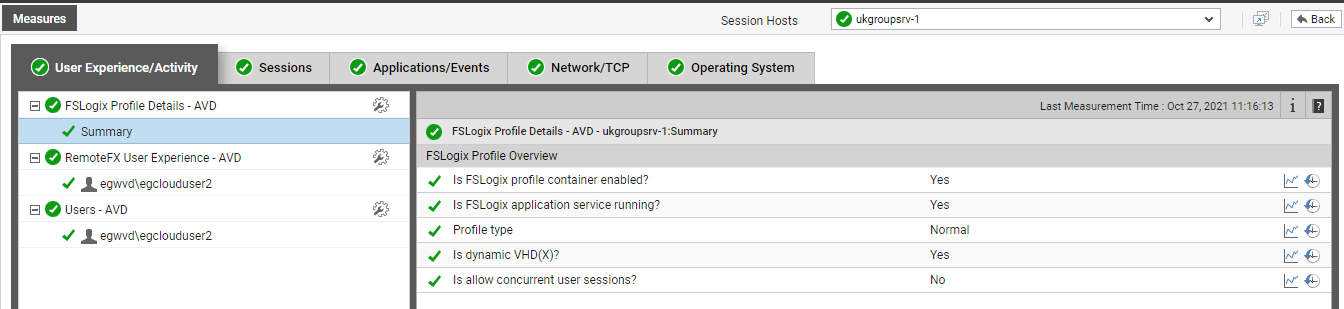
- In Figure 30 that then appears, you will find a Session Host drop-down that will display the session host that you clicked on in Figure 2. You can switch to any other session host in the pool by selecting that host from the Session Host drop-down. The metrics related to the chosen session host will then be displayed in the Measures tab page that appears below. These metrics will be organized and displayed in tab pages - one each for every layer.